NEAR Protocol Tests Critical $1.80 Support as Momentum Indicators Flash Warning Signals
Market Structure Shifts Lower
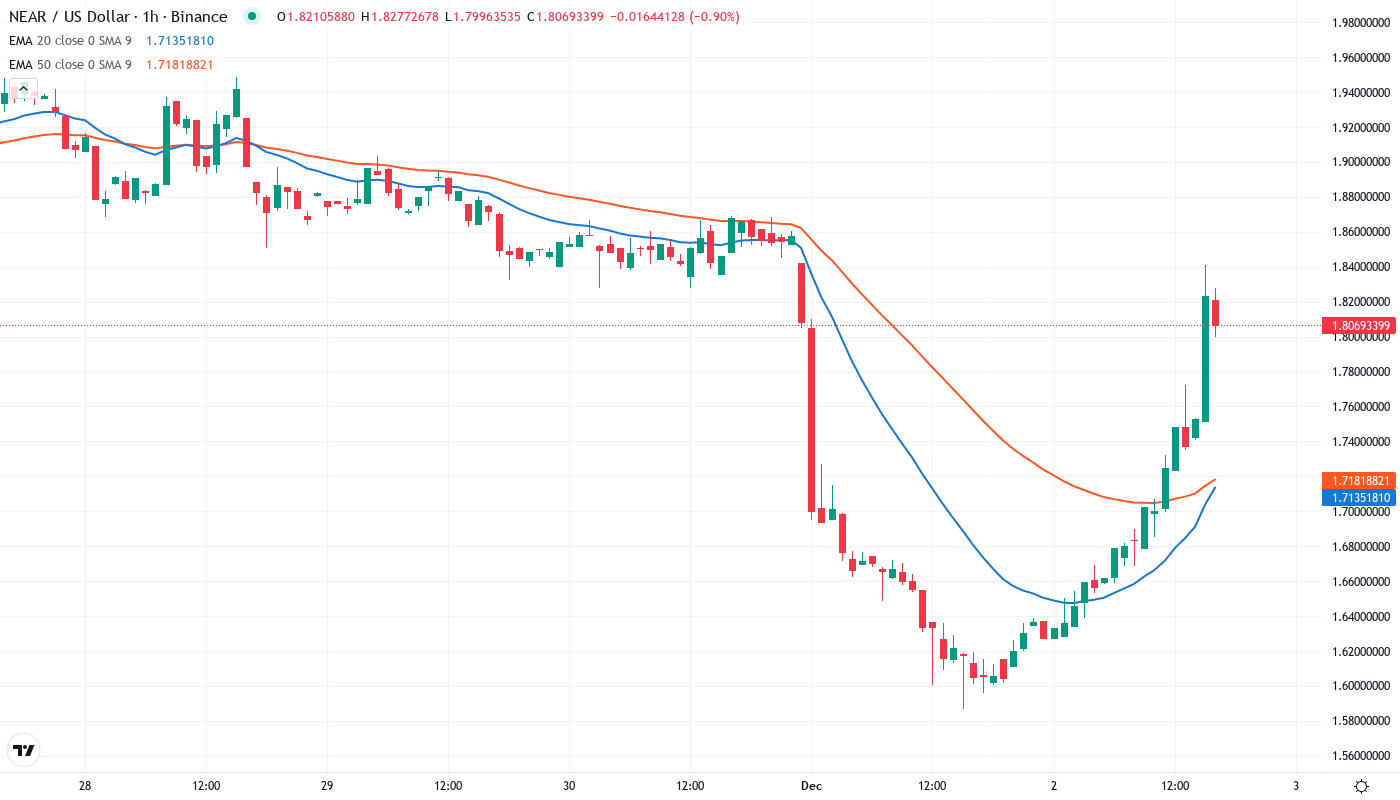
- NEAR trades at $1.80, matching crucial support after a devastating 27% monthly drop
- RSI plunges to 39.8 on the daily timeframe, first oversold reading since August
- Bulls defend the psychological $1.80 level for the third time in six weeks
NEAR Protocol’s price action tells a story of determined defense at a critical juncture, with the token clinging to $1.80 support after shedding 27% over the past month – roughly $0.68 erased from November highs. The weekly performance shows a 5.5% decline, but what’s revealing is how this level has transformed from a September breakdown point into today’s last-stand support, tested repeatedly as prominent traders like Van de Poppe place bullish bets on the recovery potential. The main question for traders is: can bulls hold this line in the sand, or will the bearish pressure that’s dominated since early December finally crack this foundation?
| Metric | Value |
|---|---|
| Asset | NEAR PROTOCOL (NEAR) |
| Current Price | $1.80 |
| Weekly Performance | -5.50% |
| Monthly Performance | -16.96% |
| RSI (Relative Strength Index) | 39.8 |
| ADX (Average Directional Index) | 21.8 |
| MACD (MACD Level) | -0.16 |
| CCI (Commodity Channel Index, 20-period) | -83.66 |
RSI Drops to 39.8 – First Oversold Signal Since August Washout
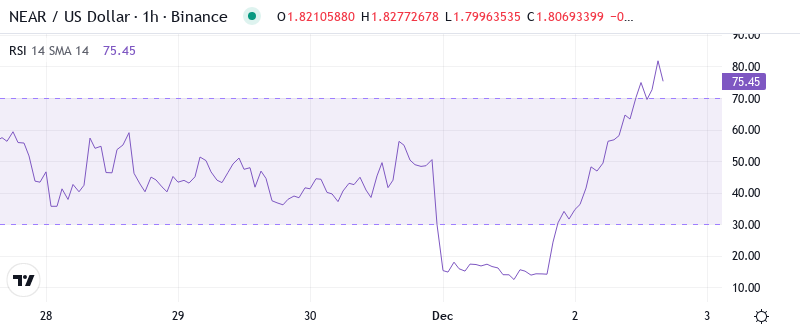
RSI sits at 39.8 on the daily timeframe, marking oversold territory for the first time since the August capitulation that preceded a 45% relief rally. This reading suggests seller exhaustion might be approaching, though the weekly RSI at 40.9 confirms the broader downtrend remains intact. What’s interesting is how quickly momentum collapsed – from neutral readings above 50 just two weeks ago to today’s oversold condition, matching the velocity of December’s price breakdown.
So for swing traders, this oversold bounce setup offers potential but requires confirmation. The monthly RSI at 43 shows there’s still room for further downside on higher timeframes, meaning any oversold bounce could face selling pressure at resistance. Basically, the momentum structure favors patient accumulation rather than aggressive longs until RSI reclaims the 50 midpoint with conviction.
ADX at 21.8 Signals Weak Trend as Market Awaits Direction
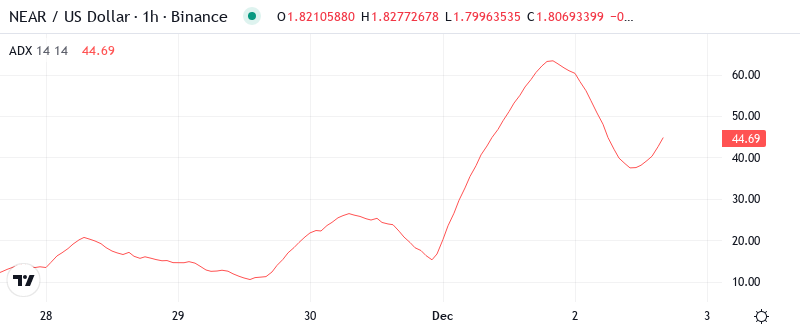
Looking at trend strength, the ADX reading of 21.8 indicates we’re transitioning out of the strong downtrend phase that dominated December. The metric has dropped from readings above 30 during the selloff, suggesting bears are losing their grip but bulls haven’t taken control yet. This compression in trend strength typically precedes the next directional move, with the market coiling between support at $1.80 and resistance near $2.20. Therefore, day traders should adapt strategies for range-bound conditions rather than trending markets. The weak ADX means breakouts in either direction could be false starts until the indicator climbs back above 25 with volume confirmation. It is worth mentioning that NEAR’s Intents platform surpassing $5 billion in volume hasn’t translated to price strength yet – technical structure needs repair before fundamentals matter.
20-Day EMA at $1.99 Caps Rally Attempts While 50-Day Looms at $2.20
Price trades below the entire EMA ribbon, with the 10-day EMA at $1.86 providing immediate resistance just 3% above current levels. The 20-day EMA at $1.99 rejected advances twice this week, confirming its role as dynamic resistance. More concerning for bulls, the 50-day EMA sits at $2.08 – a full 15% above current price – creating a thick resistance band between $1.86 and $2.20 that needs clearing for any sustainable recovery. What’s crucial here is the 200-day EMA positioned at $2.59, roughly 44% above current levels. This massive gap illustrates how far NEAR has fallen from its longer-term trend, with price now testing levels not seen since the 2023 bear market. The EMA structure screams caution for bottom-fishers – multiple resistance layers overhead mean any bounce faces selling pressure at predictable levels. That former support cluster around $2.00-2.20 now transforms into a formidable barrier bulls must conquer.
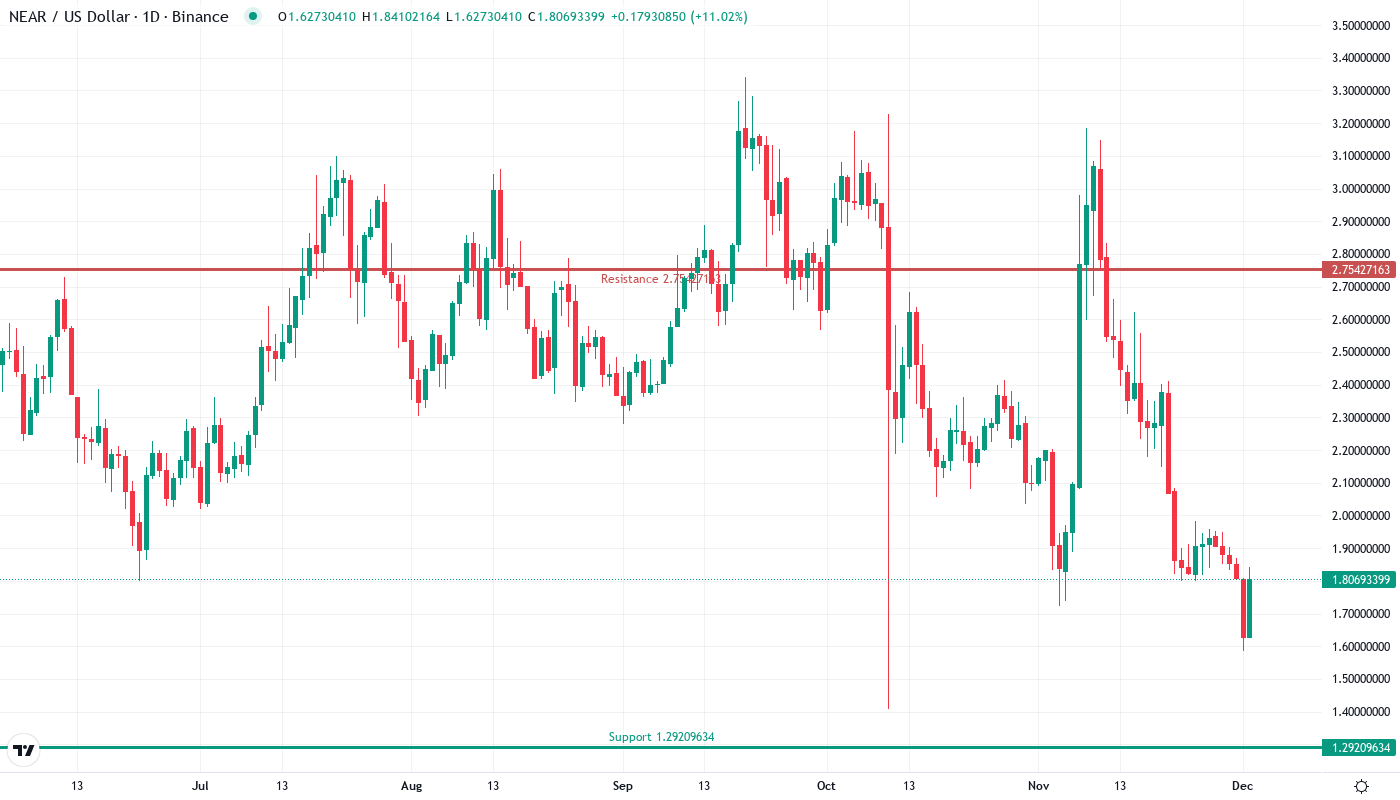
$1.80 Support Holds After Six Tests While Resistance Stacks Heavy Above
The immediate resistance zone spans from December’s breakdown level at $2.13 to the psychological $2.00 round number. This area coincides with the monthly pivot at $2.38, though that seems distant given current momentum. Sellers have defended this zone aggressively, with each rally attempt failing before $2.00 since mid-December. The confluence of horizontal resistance and the EMA cluster creates a rejection zone that’s rejected three separate advances.
Bulls defend multiple support layers beneath current price, with $1.80 proving its worth through six separate tests since June. Below this, the monthly S1 pivot at $1.29 offers a potential downside target should $1.80 fail – representing another 28% drop from here. The August lows near $1.00 mark the psychological floor where Van de Poppe and other prominent traders see extreme value, though reaching that level would mean a 45% plunge from current prices.
This configuration resembles a descending triangle pattern with $1.80 as the horizontal support. Each bounce weakens as sellers press from above, suggesting this support might not survive a seventh test. The lack of volume on recent bounce attempts indicates buyers remain sidelined, waiting for either capitulation below $1.00 or a decisive reclaim of $2.20 before committing capital.
Bulls Require Decisive Close Above $2.20 to Shift Momentum
Should price reclaim and hold above the 50-day EMA at $2.08, bulls could target the 200-day EMA at $2.59 while the Intents platform’s growing adoption provides fundamental tailwinds. A weekly close above $2.20 would invalidate the bearish structure and likely trigger short covering toward $2.50, especially if accompanied by broader market strength.
The setup fails if NEAR loses $1.80 support on volume, which would likely trigger stop-loss cascades toward the psychological $1.00 level that analysts track as the next major support. A daily close below $1.75 confirms the breakdown and opens an air pocket to monthly S1 at $1.29, potentially trapping recent bottom-fishers who entered on the triple-support narrative.
Given the oversold RSI, weakening ADX, and repeated defense of $1.80 support, the most probable near-term path sees NEAR consolidating between $1.75-2.00 before the next directional move. The technical damage needs time to repair, suggesting patient accumulation beats aggressive trading until either support breaks or resistance clears with conviction.