NEAR Protocol Slips Below $1.50 as Cross-Chain Expansion Meets Market Headwinds

Market Structure Shifts Lower
- NEAR is currently priced at $1.50, which is a 17% decrease over the week.
- This comes at a time when the Solana integration has been successful, but despite the news RSI remains at 40.16 and hasn’t capitulated fully yet.
- The $1.29 support was tested, and bulls are trying to avoid a further correction.
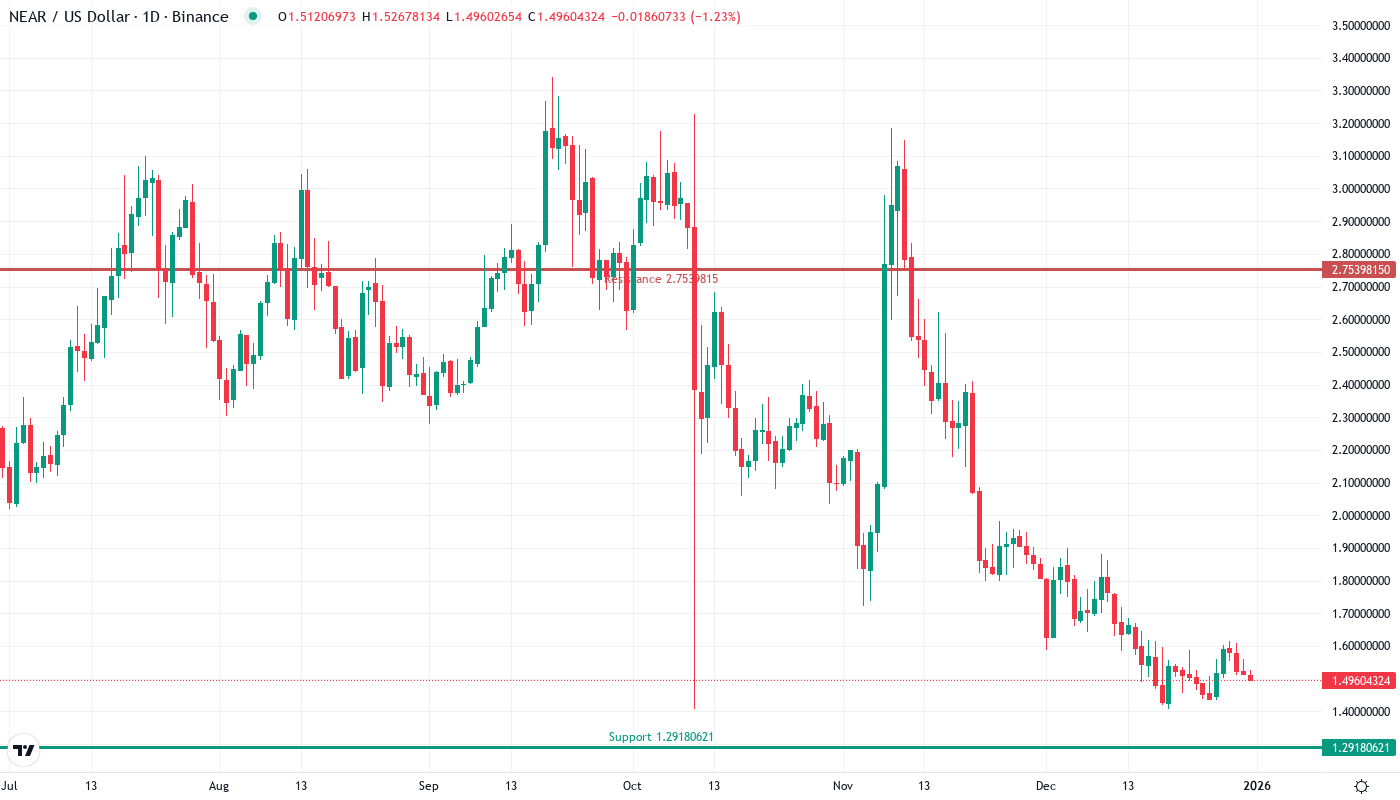
The price of NEAR Protocol declined by 17.16% this week to hit $1.50, a move that marks six straight weeks in the red. The previous support at $2 failed to hold during the broader market weakness over recent weeks and now finds itself as the immediate resistance level on the daily timeframe. The Rally Attracts Sellers support at $1 failed to hold during the recent breach, but the extent of the bounce did see buyers step in with price discovery after reversal from $1.33.
| Metric | Value |
|---|---|
| Asset | NEAR PROTOCOL (NEAR) |
| Current Price | $1.50 |
| Weekly Performance | 0.66% |
| Monthly Performance | -17.16% |
| RSI (Relative Strength Index) | 40.6 |
| ADX (Average Directional Index) | 32.4 |
| MACD (MACD Level) | -0.07 |
| CCI (Commodity Channel Index, 20-period) | -46.76 |
RSI Drops to 40.16 – Approaching Oversold Territory Without Panic Selling
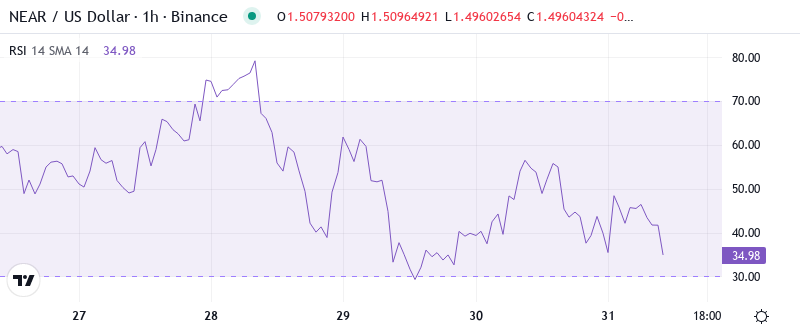
With the oscillator at 40.16, at the moment, we have momentum exhaustion but not the potential capitulation levels that have been associated with previous lows. The RSI index is presently reading at that level on the daily timeframe. This indicates that the sellers have been in charge, but not the panic flush kind of selling where the index has fallen below 30. We are in that rather uncomfortable middle ground where the selling has been relentless, rather than climactic.
What is particularly striking here is the disconnect between the price levels and fundamentals. Comparable RSI readings back in September, with the oscillator fluctuating between 38 and 42, came about before the 35% relief rally materialized. This indicated that the increased selling pressure reached critical levels, pushing the prices dangerously low out of the proper trading range. For short-term traders, such a relatively even RSI reading for Decentraland also pushes them toward the sidelines. A successful oversold bounce needs the RSI to fall below 35 or look for some bullish divergence to develop with the price testing the downside and RSI starting to trend higher.
ADX at 32.39 Confirms Trending Conditions – Bears in Control
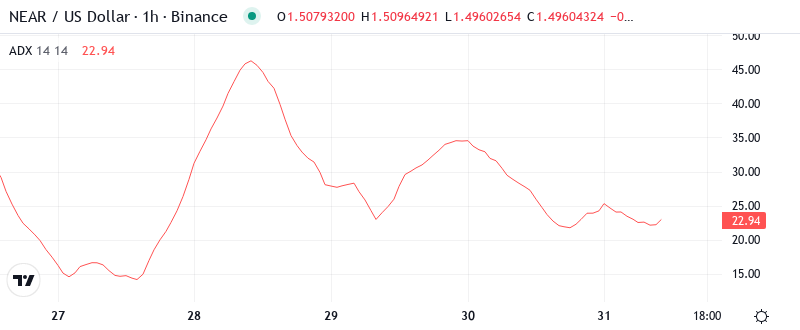
With the price failing to hold onto early gains yesterday and then breaking below the 0.382 Fibonacci retrace of the recent downtrend at 35.12, it upped the pressure on the 32.24 recent low. If this level were to give, the quick move to target would be the 61.8 Fibonacci of the 2022 range at 29.60, with the trader’s support from late November at 30.75 likely to pose little in the way of defense.
People who follow trends know what to do now that ADX verifies that the downtrend is legitimate. In other words, ADX signals that we moved from trading in a range in which it paid off to use the mean reversion strategy, to a trend phase in which the momentum strategy should prevail for a day trader. You simply make this adjustment and sell the rally rather than buy the decline until ADX falls below 25 or the price rises above important resistance levels that would eliminate the bearish pattern.
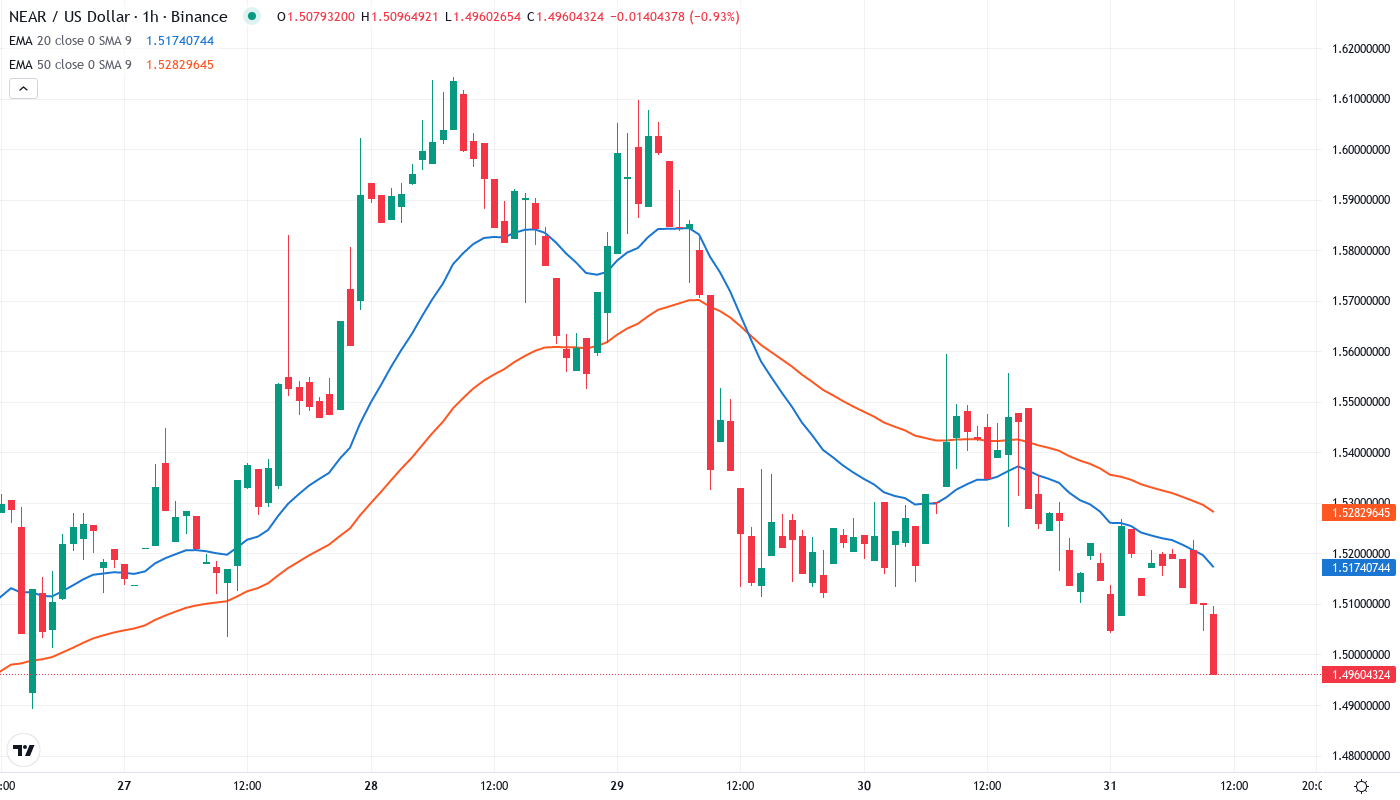
20-Day EMA at $1.56 Becomes First Resistance After Support Failure
The total market capitalization has also recorded a notable increase — from $14,680 billion to $15,012 billion this weekend or over the last weeks. The last time this metric saw the $15 trillion level was in late November. Consequently, though the cryptocurrency market has bounced off these lows, the outlook remains bearish until the EMA support resistance flips and the total market capitalization regains the EMA neighbourhood.
A clear make or break level resides at the 100-day EMA around $1.35 which caught the early December drop before price launched higher. Should that fortification fail to hold in the event of further downside, the 200-day EMA near the $1.00 psychological level will likely be put to the test. Suggestions to launch longs off the latter zone might be premature given how deeply oversold the overall market remains. A more attractive scenario for bottom pickers would be seeing the flush lower stop-out remaining weak hands before running back through the 100-day EMA to establish triple-bottom validity. This would increase the probability for a more substantial relief rally that could challenge the 20-day EMA. For the impatient, daily closes below the 100-day EMA would likely trigger entries on clear momentum to the downside, with uncharted waters expected to be extremely violent.
Resistance Stacks Between $1.53 and $1.77 While Support Thins Below
There is an immediate resistance cluster located between $1.53 (10-day EMA) and $1.564 (20-day EMA), from which the price of LUNA was aggressively sold off despite the Solana cross-chain launch. The confluence of the psychological $1.60 level and the weekly pivot was seen as a formidable resistance zone above the 10 and 20-day EMAs. The 50-day EMA rests at $1.77, which has limited rebound attempts for the past three weeks.
The support architecture does seem lighter after this week’s collapse. While $1.40 did serve as a floor during the decline and was the late-November low, the real floor is at $1.29 – the 200-day moving average. This long-term moving average was last touched in late-October and represents the final major line of support before $1.00 psychological support kicks in. That $1.29 area also is about halfway between current prices and the monthly low in November.
The market structure is clearly bearish as long as the price remains below $1.56. The consolidation between the current levels and the 200-day EMA at $1.29 is likely to reach a breaking point soon. Either the long-term support will hold and a new uptrend will begin, or its breakdown will lead to a sharp selloff to $1 and potentially even to $0.91. The bullish view will become invalid if the price slips below the key support at $0.91. The news of the Solana integration and the upcoming NPRO token launch on December 15 has failed to stop the correction, which means that the technical setup continues to put pressure on the price.
Bulls Need Daily Close Above $1.56 to Shift Momentum
Buyers urgently need to close XRP above the $0.78 level. A successful retest would likely push XRP upwards to the $0.88 level. If the buyers continue to push, a move upwards for XRP is confirmed. On the weekly chart, the $0.88 to $0.94 level is a strong resistance zone with the 20 EMA.
If the bearish scenario plays out, NEAR/USD is likely to bounce at the 200-day EMA, with stops found under the $1.20 mark, in case traders are not filtered out in the rush to take out the $1.30 level. Intermediate resistance is seen at the $1.60 level. This would become minor support on the downside once the 200-day EMA is cleared to the downside; previous resistance will now act as support on the next test.
Since there is a strong ADX trend reading and price is positioned below all the key EMAs, the more likely scenario in the NEAR term is that weakness persists and a test of the $1.29 support is made. In the absence of any bullish fundamental catalysts to drive prices higher soon, NEAR must first show it can hold the 200-day EMA if a stronger recovery is to materialize. The Solana integration is favorable for the project in the FUNdamental term. For now, however, the TECHNicals prevail.