Monero Surpasses $427 as Privacy Coin Tests Multi-Month Highs Despite Regulatory Headwinds
Market Structure Moves Higher
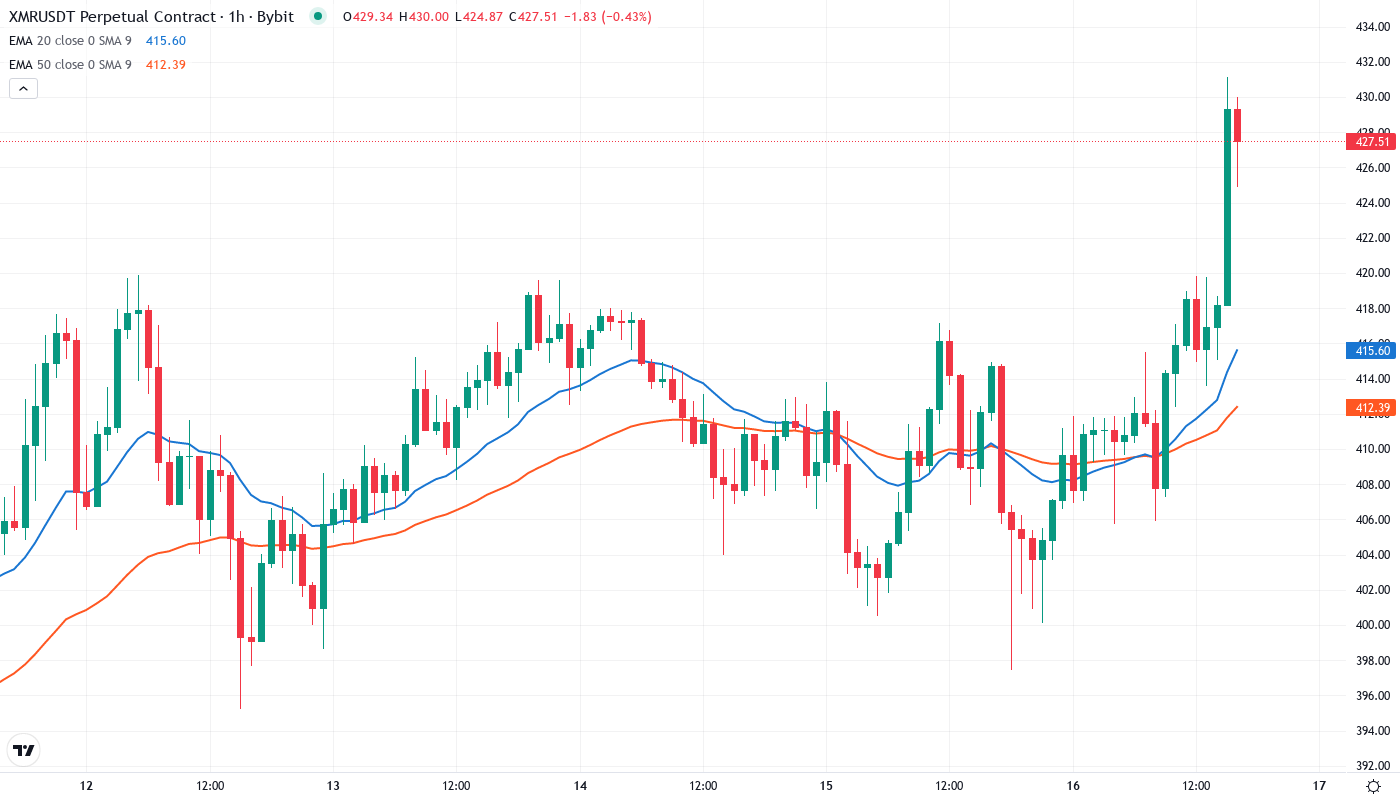
- Monero (XMR) surged 14.3% on a weekly basis, breaking through $400 resistance with considerable ease and continuing towards $427.88.
- The price momentum prevails despite Europol’s successful operation against a criminal network using a crypto mixer.
- Governments are raising spending on blockchain analysis and crypto tracking, with $191 million proposed for FinCEN’s anti-money laundering and crypto surveillance efforts as part of the $3.1 trillion 2022 budget.
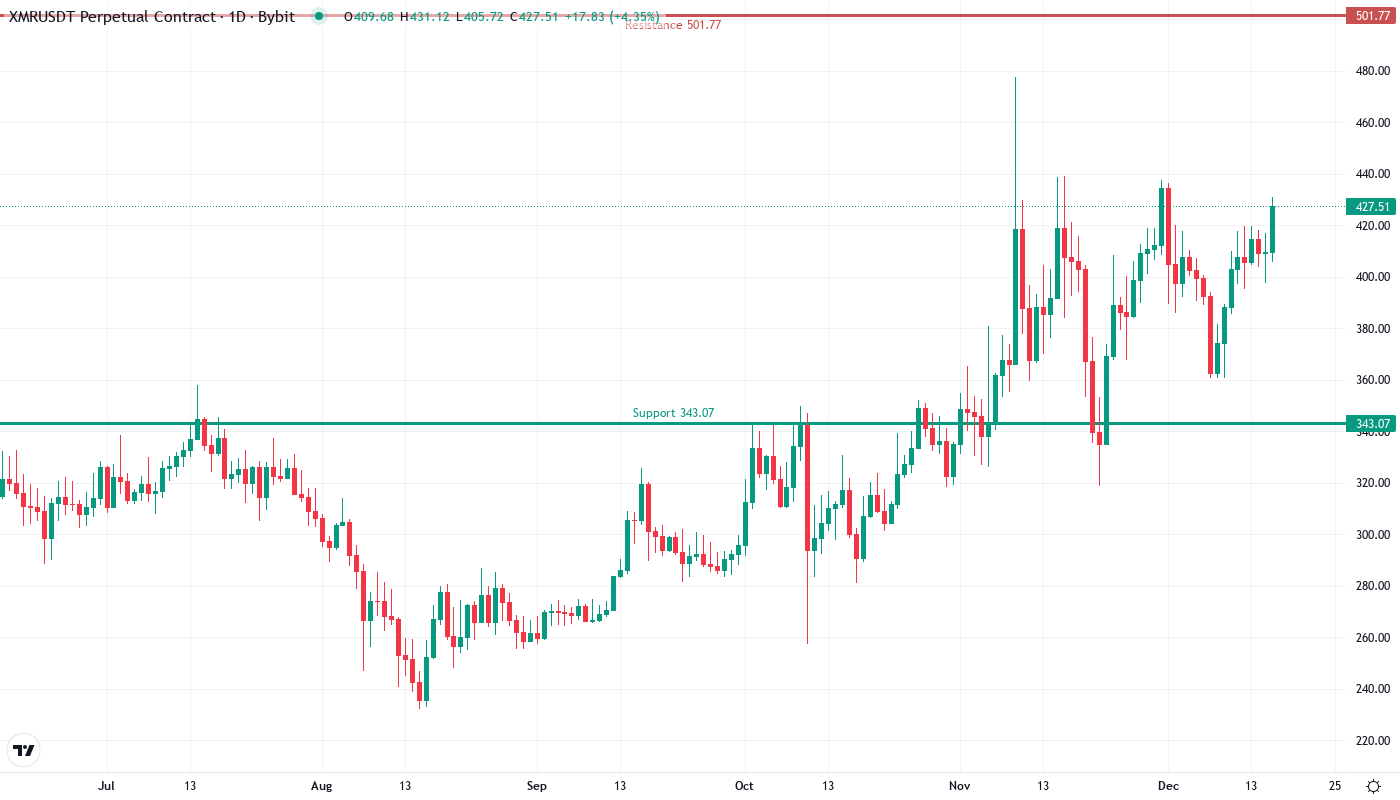
Monero started December with a 14.3% weekly jump, rising from about $374 to $427.88 as privacy fans ignored regulatory concerns. Advancing the biggest weekly gain since the summer rally, the privacy currency is now up 33.9% in three months despite a €25 million seizure of Europol’s largest crypto-mixing facility and South Korean agents issuing $11.3 million of blockchain tracking equipment. The new question for traders is whether XMR can keep this push over $400 or if another retracement will be caused by regulatory headwinds.
| Metric | Value |
|---|---|
| Asset | MONERO (XMR) |
| Current Price | $427.88 |
| Weekly Performance | 14.30% |
| Monthly Performance | 2.15% |
| RSI (Relative Strength Index) | 61.0 |
| ADX (Average Directional Index) | 18.7 |
| MACD (MACD Level) | 8.65 |
| CCI (Commodity Channel Index, 20-period) | 120.58 |
Momentum Holds Steady at 60.99 – Neither Overbought Nor Oversold
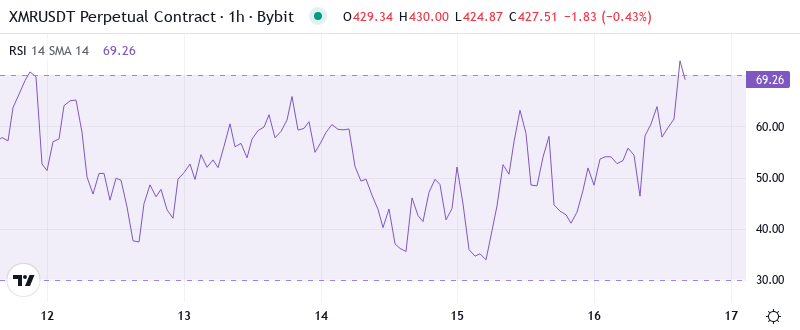
The Relative Strength Index (RSI) can be a reliable momentum predictor for cryptocurrencies. It shows that Monero (XMR) is neither oversold nor overbought on the daily timeframe. The indicator currently sits near 61 after the altcoin saw a minor rally in recent days. This should give the bulls enough confidence to pull XMR higher before RSI reaches levels where traders typically start taking profits. During the local peak in late November, the RSI went over the 74.70 mark before it started reverting lower. The current picture is similar to late September 2021 as RSI was hovering at 62.20 before Monero went on a major spree towards $180.
Therefore, for swing traders, this neutral-to-bullish RSI suggests entries are still possible on pullbacks to support as overbought signals are absent and should they continue to be so, upside targets remain unaffected. The coin’s perseverance is noteworthy as it continues to push higher despite negative press around React bugs that have allowed Monero mining on vulnerable crypto sites—news that would generally have a more substantial impact on sentiment but has not seemingly altered the technical outlook.
ADX at 18.7 Signals Early Trend Development After Extended Consolidation
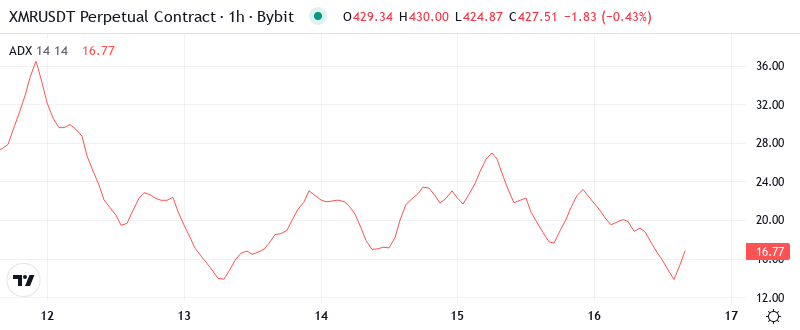
Analyzing trend strength, the ADX stands at 18.72, and that means choppy sideways action could be turning into a trend. When the ADX rises from below 20 to above 25, it can be a sign that the market is taking a direction after a consolidation period. This reading indicates the asset is seeing early rising trend strength with increasing conviction, though it hasn’t reached extreme readings just yet.
So, day traders will want to use strategies for when the markets are trending, rather than range-bound ones. The increasing ADX supports this, as does December’s move over $400. Such a move shows real demand rather than false rallies. The added bonus is that this acceleration of the trend also saw the trading firm, Baltex, launch BTC to XMR private swaps on December 9. This is interesting as an infrastructure development can actually underpin a technical breakout.
50-Day EMA at $381.71 Transforms From Resistance to Critical Support
When assessing an altcoin’s potential to move independently, it’s always good to unwrap it from the BTC pair and make sure we have the whole picture. Looking at USD pairs on their own helps identify standout relative strength as many pair up the Bitcoin. It appears XMR on the USD side is in much better positioning.
What is interesting to note is that the 100-day EMA at $356.36 currently serves as solid backstop, roughly $70 beneath present levels, which gives ample breathing room for any retreat. The consolidation zone that previously served as a resistance in the $380-$381 area now morphs into the red line that the bulls need to protect on any fallback. The 10-day and 20-day EMAs are pinching together which means that the short-term momentum is still positive as the lesser averages are moving up to overtake the prevailing rate.
Resistance Clusters Between $437 and $568 as Bulls Eye Summer Highs
Above the current price, the first level of resistance is at $437.53, the December monthly high, combined with the psychological level. The second at $500, XMR also has to break, first already tested this month. The third one is at $568.99, XMR’s weekly level.
Bulls are defending a solid support structure based on the former breakout level at $400, as well as the 20-day EMA at $401.09. A more robust floor is located at $381.71 where the 50-day EMA meets the psychological $380 level. XMR has recovered from this region on several occasions and it has become a solid demand zone that would have to be breached for bears to take over control.
This setup establishes a well-defined $381 to $437 range for price discovery in the coming weeks. The setup is tilted in favor of bulls, provided Monero maintains above its 50-day EMA on a retracement, with the privacy-focused alt set to target an extended rally through December’s high if it breaches that level with authority.
Bulls Require Daily Close Above $437.53 to Unlock $500+ Targets
If XMR manages to secure a daily closure above $437.53, the road to $500 would likely open up, with $468 posing as the interim resistance point. To solidify the breakout, bulls would require persistent momentum and sufficient volume, given the current regulatory pressures on privacy coins. That being said, the Baltex BTC-XMR swap launch would offer underlying demand.
If the price hard rejects at $437 and tumbles below $381.71 with a spike in volume, this would catch the December buyers on the wrong foot, and panic selling could drag the price down to $356.30. A break below the 50-day SMA will suggest that the uptrend has topped out. In such a case, the decline can extend to the 20-day EMA. A break below this support will indicate that bears are back in the game. This view will be invalidated if the BTC/USD pair recovers and sustains above $437.
Considering the consistent technical set up and combined bag of fundamentals, XMR is likely to remain consolidated between $400-$437 before making a next uptrend. Post such recent surge, the privacy coin has to digest the gains and observe the effect of enforcement on the demand side by users for transactions in anonymity over the weeks.