Litecoin Darts Through Support as SEC ETF Approval Fails to Spark Rally
Market Structure Shifts Lower
- LTC tumbles 17.6% weekly despite inclusion in newly approved Bitwise 10 Crypto Index ETF
- Hashrate surges 117% signaling miner confidence while price action tells opposite story
- Critical support at $79.76 tested as momentum indicators flash capitulation warnings
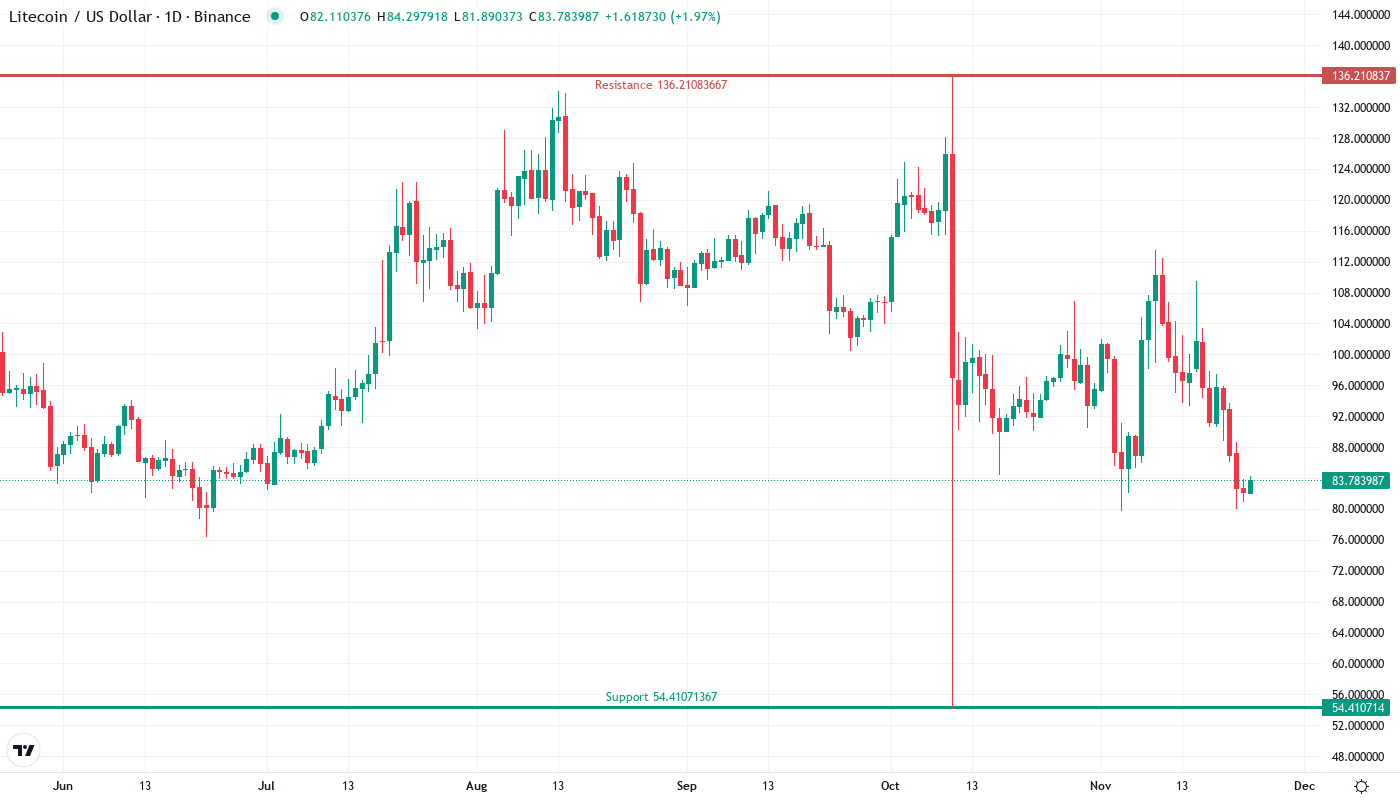
Litecoin’s price action delivered a sobering reality check this week, plunging 17.62% to $83.70 even as the SEC approved the Bitwise 10 Crypto Index ETF featuring LTC among its holdings. The devastating drop erased over a month of gains, with the monthly performance now showing an 11.1% decline that has traders questioning whether the ETF inclusion narrative carried any weight at all. The main question for traders is: can Litecoin defend the psychologically important $80 support zone, or will the disconnect between surging network fundamentals and collapsing price action trigger further capitulation?
| Metric | Value |
|---|---|
| Asset | LITECOIN (LTC) |
| Current Price | $83.70 |
| Weekly Performance | -17.62% |
| Monthly Performance | -11.11% |
| RSI (Relative Strength Index) | 39.1 |
| ADX (Average Directional Index) | 16.8 |
| MACD (MACD Level) | -3.60 |
| CCI (Commodity Channel Index, 20-period) | -112.05 |
Momentum Exhaustion Signals Capitulation Phase Complete
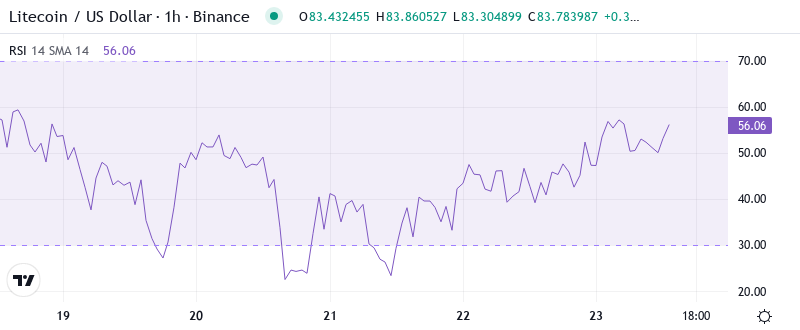
RSI sits at 39.11 on the daily timeframe, marking the first dip into oversold territory since the August washout that preceded a 40% recovery rally. What’s particularly revealing is how rapidly momentum collapsed – just two weeks ago, the oscillator hovered comfortably above 60 as bulls maintained control of the trend structure.
Similar RSI configurations in September and November both marked significant bottoms, with the indicator spending less than 48 hours below the 40 threshold before sharp reversals materialized. So for swing traders, this oversold reading combined with the 117% hashrate surge suggests accumulation opportunities are emerging, though catching this particular falling knife requires strict risk management given the velocity of the current decline.
Weak ADX at 16.77 Keeps Range Traders in Control
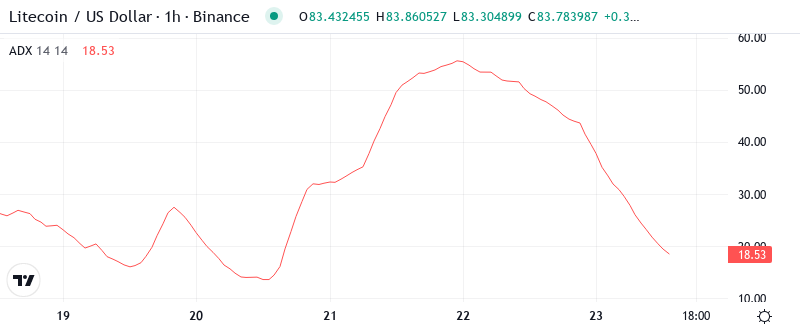
At the level of 16.77, the ADX entry indicates that despite the sharp weekly drop, we’re actually transitioning from trending to ranging conditions rather than accelerating the downtrend. Basically, being in this zone below 20 tells us the directional conviction behind the selloff is already waning, which often precedes a period of sideways consolidation.
To clarify, the ADX is indicating that we are switching from impulsive price action to a more balanced state where neither bulls nor bears hold decisive control. Therefore, day traders should suit their strategies to this change – expect ping-pong action between support and resistance rather than continuation moves, at least until ADX climbs back above 25 to signal renewed trending conditions.
20-Day EMA at $89.30 Becomes First Resistance After Support Flip
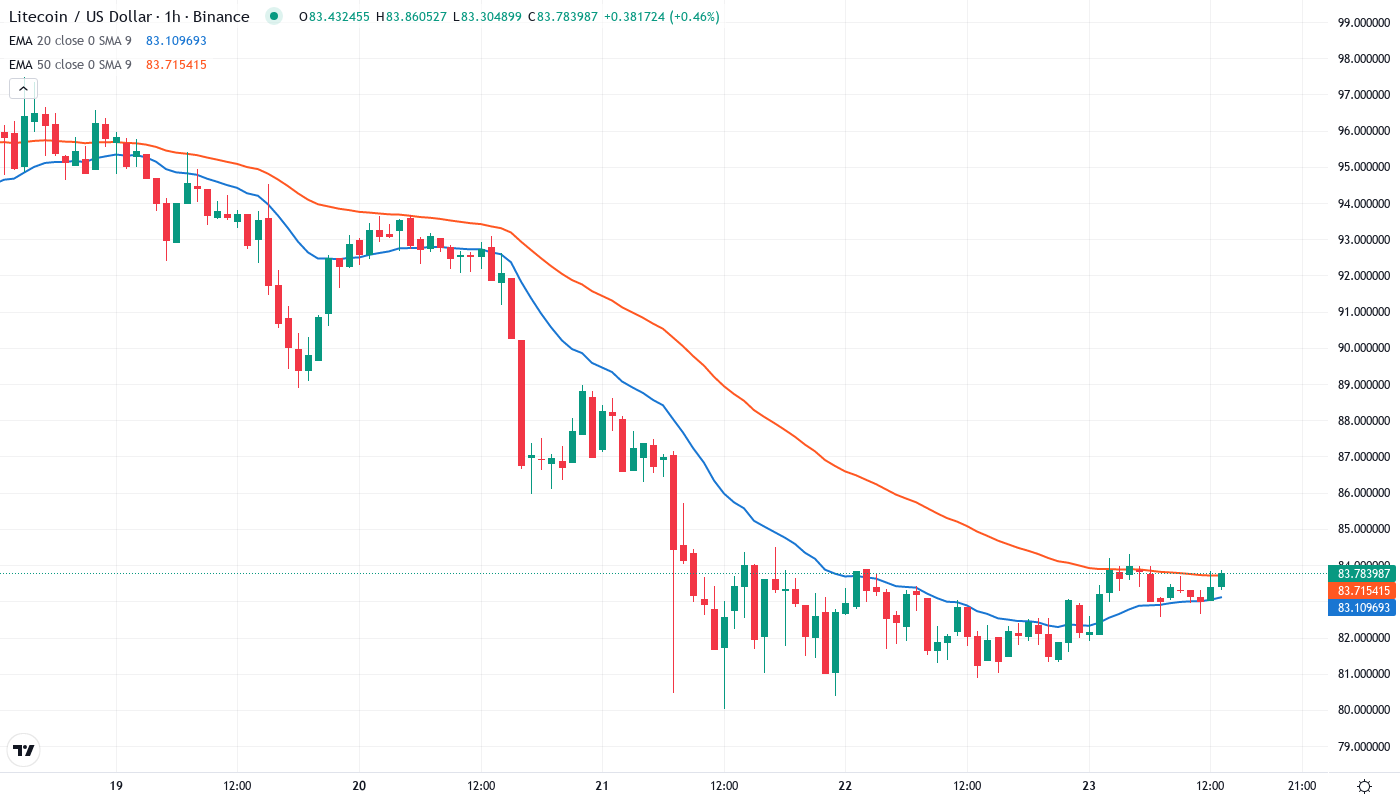
Price action is very clear through the EMA ribbons. LTC is positioned below the 10-day ($89.30), 20-day ($92.65), and more critically, the 50-day EMA at $94.55 – creating a stacked resistance structure that will challenge any recovery attempts. The 20-day EMA changed from being a support level to a resistance one during this week’s breakdown, and that flip occurred on heavy volume as ETF enthusiasm evaporated.
Looking at the broader moving average architecture, the 100-day EMA at $95.14 and 200-day EMA way up at $94.27 (weekly timeframe) form a ceiling of resistance that essentially caps upside potential in the $94-95 zone. That former support area at $89.30 now transforms into the first hurdle bulls must clear to even begin discussing trend reversal – until then, the path of least resistance remains lower.
Monthly Low at $79.76 Anchors Final Defense for Bulls
The immediate resistance is set at the zone from $89.30 to $92.65 where the 10 and 20-day EMAs cluster with recent breakdown levels. Above that, sellers have stacked multiple barriers with the 50-day EMA at $94.55 forming the next major resistance confluence, reinforced by the psychological $95 round number where both the 100-day EMA and weekly 200-day EMA converge.
Bulls defend their final stronghold at $79.76, which marks the monthly low and has provided reliable support since June. The support line now looks much more fragile after this week’s 17% plunge, with only minor cushions at $80 (psychological) and the distant $54.41 level representing the next meaningful floor if current support fails. It is worth mentioning that the hashrate explosion to record levels creates an interesting divergence – miners are betting heavily on Litecoin’s future even as spot traders bail.
This configuration resembles a compressed spring between $79.76 and $89.30, with the market needing to pick a direction soon. The structure of the market signals seller dominance as long as price remains below $89.30, but the oversold RSI combined with ranging ADX suggests we might see a relief bounce attempt before any continuation lower.
Bulls Need Reclaim of $89.30 to Shift Momentum
Bulls require a decisive close above the 20-day EMA at $89.30 to neutralize the immediate bearish pressure and open a path toward testing the $94-95 resistance cluster. Should price reclaim this level on volume, the oversold bounce could extend toward the 50-day EMA, especially if the Bitwise ETF begins attracting meaningful inflows that translate to spot buying pressure.
The bearish domino falls in the event that price fails to hold $79.76 on a daily close – this would trap recent dip buyers betting on ETF-driven demand and likely trigger liquidations targeting the $54 support zone. Rejection at the $89.30 resistance after any relief rally would confirm the downtrend remains intact, setting up another leg lower.
Given the technical configuration with oversold momentum indicators meeting strong overhead resistance, the most likely short-term path is for Litecoin to consolidate between $79.76 and $89.30 while the market digests both the ETF approval disappointment and the bullish hashrate divergence. The 117% hashrate surge suggests smart money sees value at these levels, but price needs to prove it can hold support before any sustainable recovery begins.