LEO Slips 5.9% Weekly as Exchange Token Momentum Stalls at $9 Support

Market Pulse
- LEO tests critical $9 support after rejecting near $9.89 monthly highs
- ADX at 34.3 signals moderate trend strength despite recent weakness
- Exchange token consolidates between $9-$9.44 as broader crypto market churns
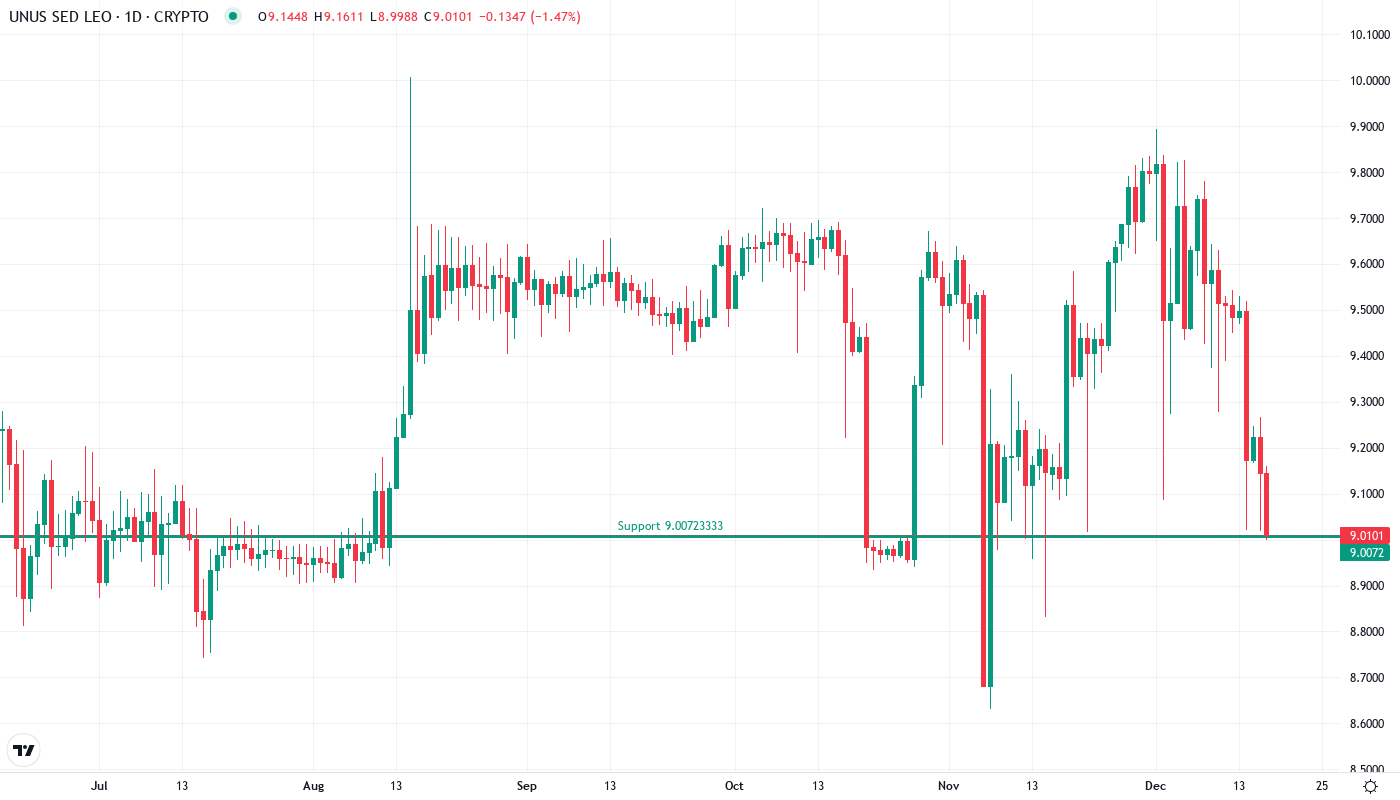
UNUS SED LEO dropped 5.93% over the past week, settling at $9.02 as the exchange token struggled to maintain momentum above the psychological $9 level. The token’s monthly performance shows a marginal 1.52% decline, though it has managed a slight 0.41% gain over the past three months – suggesting a prolonged consolidation phase rather than an outright bearish reversal. The main question for traders is: will LEO defend the $9 support that has anchored price action throughout December, or are we witnessing the early stages of a deeper correction?
| Metric | Value |
|---|---|
| Asset | UNUS SED LEO (LEO) |
| Current Price | $9.02 |
| Weekly Performance | -5.93% |
| Monthly Performance | -1.52% |
| RSI (Relative Strength Index) | 35.1 |
| ADX (Average Directional Index) | 34.3 |
| MACD (MACD Level) | -0.08 |
| CCI (Commodity Channel Index, 20-period) | -190.27 |
Momentum Holds Neutral Territory at 47.8 – Neither Bulls Nor Bears Command
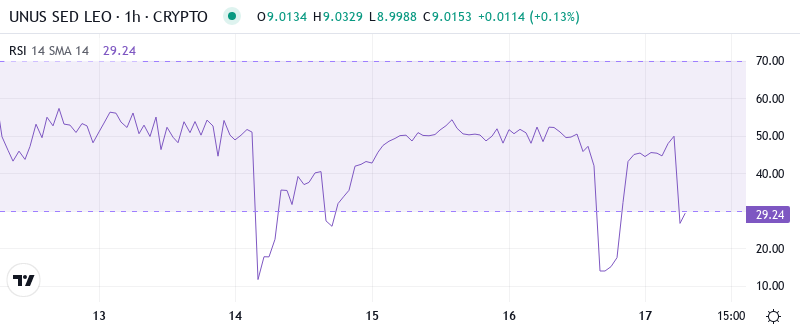
RSI sits at 47.84 on the daily timeframe, placing momentum squarely in neutral territory where both directional trades remain viable. This balanced reading follows a decline from overbought conditions near 60.8 on the monthly timeframe, indicating that selling pressure has cooled without triggering capitulation. The oscillator’s position suggests LEO has room to move in either direction without immediate oversold or overbought constraints.
What’s revealing is how RSI behaved during the recent 5.93% weekly decline – it dropped from 58 to 47.84 without breaching the 40 level that typically marks oversold conditions. Similar RSI configurations in LEO’s past, particularly when holding above 45 during pullbacks, have preceded consolidation periods rather than extended selloffs. So for swing traders, this balanced RSI means patience is warranted – wait for a directional break above 55 or below 40 before committing to momentum trades.
ADX at 34.3 Confirms Active Trend Despite Recent Weakness
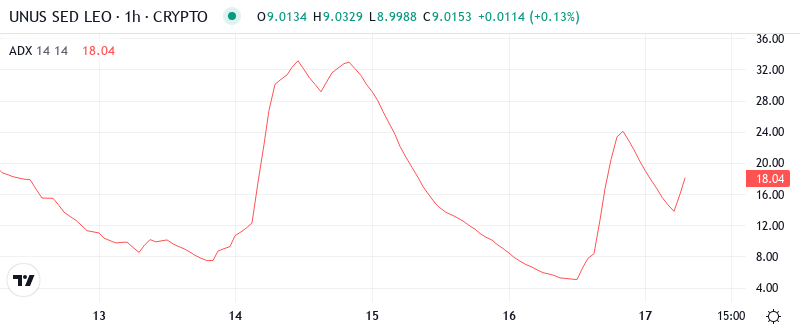
Looking at trend strength, the ADX reads 34.31, indicating that despite the recent price weakness, an active trend remains in play. This reading sits well above the 25 threshold that separates trending from ranging markets, yet below the 40+ extreme levels that often mark trend exhaustion. Basically, LEO’s price action maintains enough directional conviction to favor trend-following strategies over range-trading approaches.
The ADX climbing above 30 while price tests support creates an interesting dynamic – it suggests that the current move has genuine momentum behind it rather than representing mere profit-taking or low-conviction selling. To clarify, when ADX stays elevated during pullbacks, it often means the dominant trend (in this case, the broader consolidation pattern) remains intact. Therefore, day traders should adapt their strategies to potential volatility expansion once LEO resolves its current support test.
Price Hovers Just Below 20-Day EMA as Moving Averages Compress
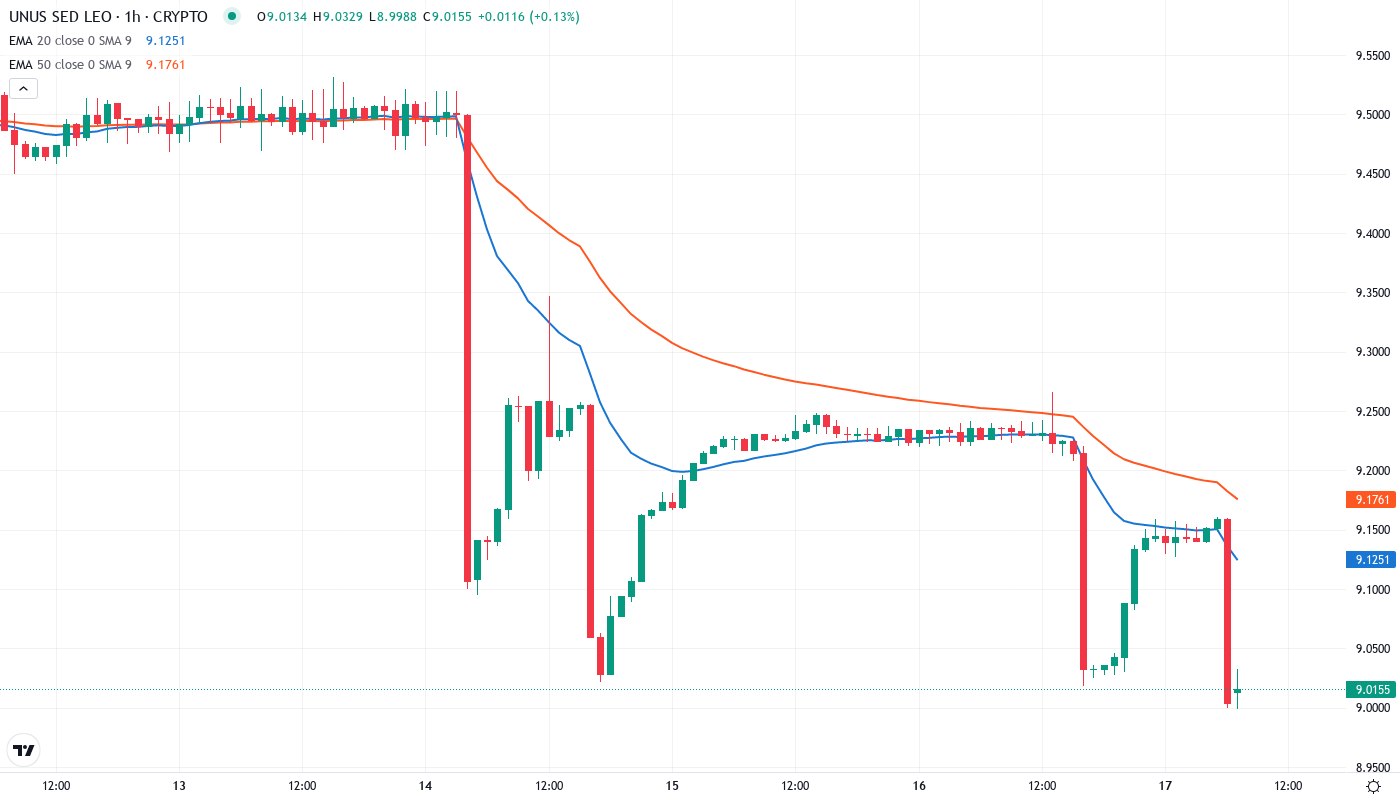
Price action tells a clear story through the EMA structure. LEO currently trades at $9.02, positioned slightly below the 10-day EMA ($9.32) and 20-day EMA ($9.41), while managing to hold above the crucial 50-day EMA at $9.44. This tight compression between the short-term averages – spanning just $0.12 from the 10-day to 50-day – resembles a coiled spring awaiting directional resolution.
More telling is the compression between support and resistance created by these moving averages. The 50-day EMA at $9.44 has transformed from support to resistance after LEO failed to sustain above it, while the 100-day EMA at $9.41 provides additional overhead pressure. This stacked resistance between $9.32-$9.44 means bulls face a significant technical barrier, requiring sustained buying pressure and likely above-average volume to reclaim the short-term uptrend structure.
Monthly High at $9.89 Caps Upside While $9 Psychological Level Anchors Support
Resistance clusters between the recent rejection at $9.89 (monthly high) and the moving average confluence around $9.44. The $9.89 level proved too rich for buyers earlier this month, creating a clear ceiling that coincides with the psychological $10 round number sitting just above. Any attempt to reclaim bullish momentum must first conquer the immediate resistance band from $9.32-$9.44 before challenging the monthly peaks.
Bulls defend multiple support layers with the psychological $9 level serving as the primary battleground. Below that, the monthly low at $8.99 offers a technical floor that held during December’s weakest moments. The proximity of these support levels – essentially creating a support zone from $8.99-$9.02 – provides limited downside cushion, meaning any breakdown could accelerate quickly toward $8.50.
This configuration resembles a compression triangle with narrowing boundaries. The structure signals that LEO approaches a decision point where the tight range between $9 support and $9.44 resistance cannot contain price much longer. Volume patterns during the next test of either boundary will likely determine whether we see a resolution higher toward $9.89 or a support failure targeting the $8.50 area.
Bulls Must Reclaim $9.44 to Reignite Upside Momentum
Should price reclaim and hold above the $9.44 resistance cluster on a daily close, bulls would regain control of the near-term trend structure. Such a move would flip the 50-day EMA back to support and open a clear path toward retesting the $9.89 monthly highs, with potential extension toward the psychological $10 level if buying momentum sustains.
The setup fails if LEO loses the $9 psychological support on volume, particularly with a daily close below $8.99. This would trap recent buyers who entered near support and likely trigger stop-loss cascades toward $8.50, where the next meaningful support lies. A breakdown below $9 would also confirm the moving average resistance and suggest further downside pressure ahead.
Given the technical configuration and neutral momentum readings, the most probable near-term outcome is continued consolidation between $9 and $9.44 as LEO digests recent moves. The compressed moving averages and moderate ADX reading suggest a larger directional move approaches, but until either boundary breaks with conviction, range-bound price action between these levels offers the highest probability setup for traders.