Kaspa Tests Multi-Month Support as EVM Bridge Launch Sparks Accumulation

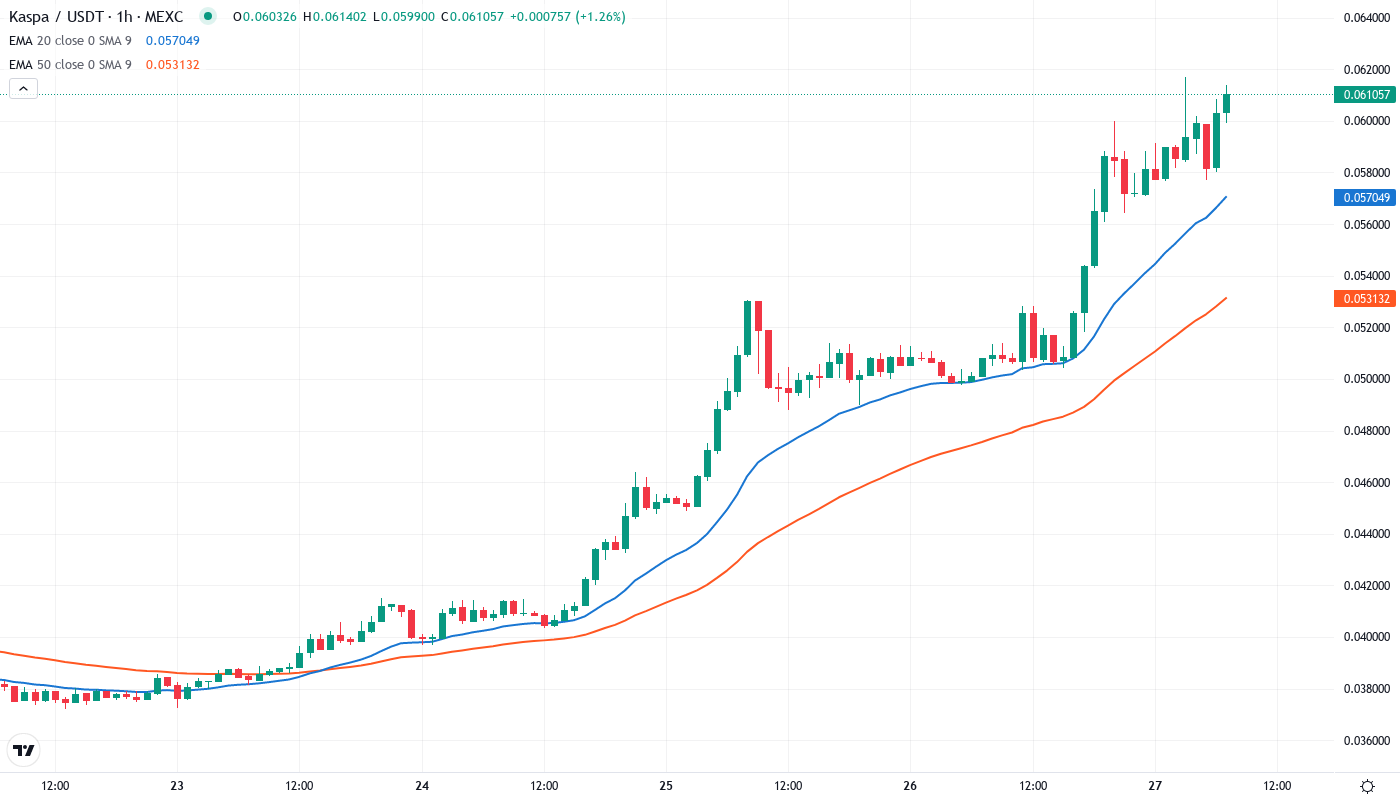
Market Structure Shifts Higher
- Large wallet buying increases even though there has been a 59% decrease from the year’s maximum
- EVM bridge implementation allows cross-blockchain connection for the initial time
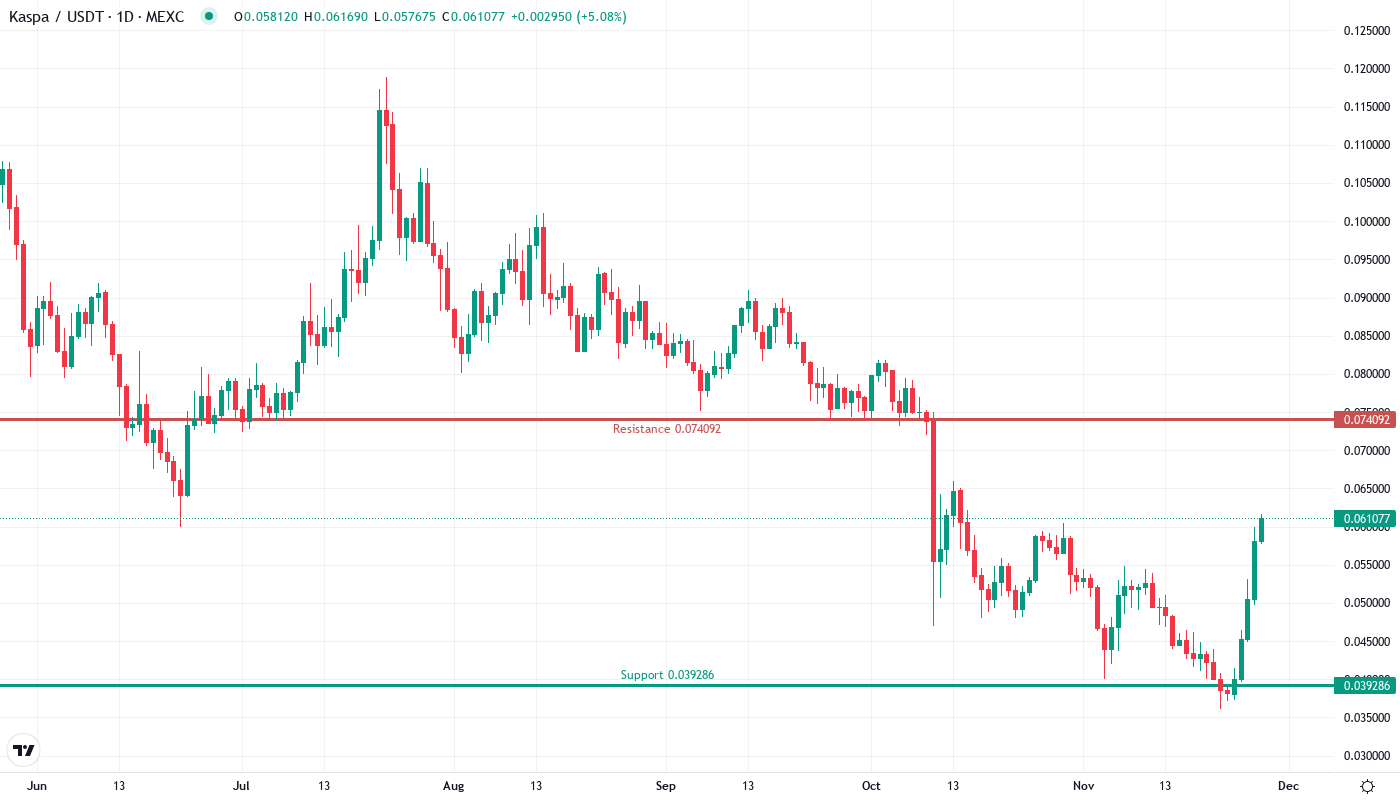
- Over six months, the $0.039 support has stood and been retested multiple times
The price performance of Kaspa gives reason for OPTIMISM AND CONCERN, is how we summarize the current price action of the KAS token.
| Metric | Value |
|---|---|
| Asset | KASPA (KAS) |
| Current Price | $0.06 |
| Weekly Performance | 43.94% |
| Monthly Performance | 6.20% |
| RSI (Relative Strength Index) | 67.6 |
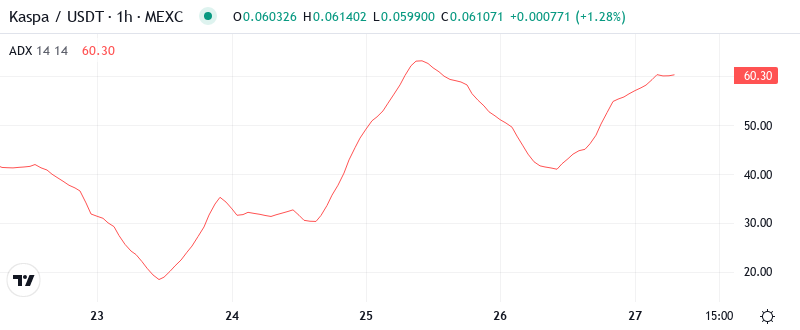
| ADX (Average Directional Index) | 33.2 |
| MACD (MACD Level) | 0.00 |
| CCI (Commodity Channel Index, 20-period) | 181.26 |
RSI at 67.6 Signals First Overbought Reading Since Pre-Crash Peak
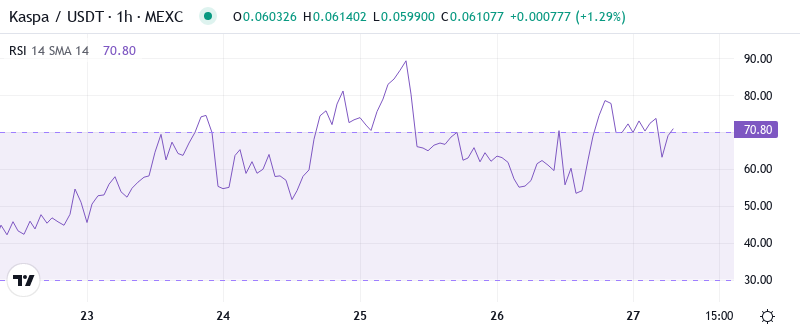
The Relative Strength Index is at 67.6 on the daily timeframe, the first foray into overbought terrain since KAS was trading above $0.15 this year. What gives me confidence is how fast momentum has changed, just a few weeks back and it was stuck near 35 as sellers wacked back every rally. RSI was in a similar position in the last couple of cycles, where we either consolidated sideways for 2-3 weeks or gave it one more push higher before a deeper correction.
Therefore, for swing traders, this high RSI has two important signals: first, the short-term tendency has become bullish; however, second, it no longer makes sense to go after the low-hanging-fruit oversold rebound trades. The EVM bridge news acted as the necessary driver of hype and with RSI gaining 30 points in less than two weeks – the level of activity not seen since the major trend changes – a continuation to the upside makes more sense. Should we reach the $0.075 area, expect either a horizontal grind or the creation of a momentum divergence.
ADX Climbs Through 33 – Trend Followers Gain Edge Over Range Traders
With a market environment like this, sometimes it’s always good to check the recent activity. I find it useful to apply a filter based on your trading style (long-term, mid-term, or short-term) to active/suppressed stocks. For example, in the case of TVTY, it was active in the last trading session.
The spike in ADX perfectly coincides with the VProgs smart contract development update news release on January 14, 2021 as big money prepares for Kaspa’s DeFi push. For those unfamiliar, an ADX above 30 suggests favorable market conditions for trends as they are likely to strengthen via the power of self-reinforcement. They’re not yet overextended and at risk of a trend exhaustion phase as is the case with an ADX above 50. For day trading, stick with the trend rather than attempting contrarian scalps in-and-out.
20-Day EMA at $0.049 Transforms From Resistance to Critical Support
When compared to traditional moving averages the Exponential Moving Average (EMA) places a higher weight on recent price action. This creates a lagging effect between price and the moving average that is used to generate signals for a trend change or potential resistances/supports. A moving average uses the average close price over a certain period to smooth the trend of price action. The EMA is specially good to rise the response for recent price changes. So, it’s a more sensitive moving average.
The most important part of this equation is the compression between the short and long term averages, with the 200-day EMA .063 converging to current levels. This resolution typically creates an immediate 20-30% move in the direction of the breach (of the averages). With the EVM bridge deployment acting as a fundamental catalyst, we should see that compression blow in the upward direction for this launch. The .048- .054 zone that was previous resistance should now act as a support floor for this new market structure.
Resistance Stacks Heavy Between $0.075 and $0.092 Monthly Highs
Sellers have established resistance levels above the current price, which are also psychological round numbers. The first one, at $0.075, is a technical level where the monthly R1 pivot intersects with the 100-day EMA. This level capped the early December rally and contains heavy volume from long positions. The second resistance level above the first one is at $0.092, where the weekly R3 pivot and the 200-week EMA converge. This level would be hard to break and would need a lot of buyers.
The bulls have a stronger support structure to defend. The $0.053-0.054 zone now has triple confluence: the rising 50-day EMA, the monthly pivot point and last week’s breakout retest from the surge. Far more importantly, the six-month support at $0.039 has morphed from final defense into a far-away safety net, which was tested six times since June, despite the multiple market wide selloffs.
The node count expansion to new all-time highs and sustained high transaction throughput demonstrate growing network fundamentals even as price consolidates. Range traders can work between $0.054 support and $0.075 resistance until one side breaks with conviction.
Bulls Need Decisive Close Above $0.075 to Confirm Trend Reversal
If the price is able to go above $0.075 and stay there based on the daily closing, it would indicate a very bullish trend and the planned targets could be increased to $0.092 and even $0.121. This can be attributed to the EVM bridge and VProgs developments acting as solid fundamentals for this uptrend, especially with DeFi projects showing interest in using Kaspa’s network with high transaction rates.
If you’re worried about lower prices, flying without a parachute or spoken too much about mandates, you’re playing poker with an Ace up your sleeve. Would-be be buyers have watched in painful astonishment as KAS broke out with explosive force only to be rapidly dragged back into the sucking quagmire of a bull trap. They don’t want to be degen apes today or FOMO #115 tomorrow… that’s you.
Based on the technical setup and recent developments, the most likely short-term direction has KAS ranging between $0.054-0.075 as investors absorb the EVM upgrade announcement. The oversold rally exhaustion, increasing network fundamentals, and significant wallet accumulation indicate that any breaches of this range to the downside will likely be short-lived as traders look to accumulate before the uptrend resumes on smart contracts.