Jupiter Plunges 15.6% as Instant Unstaking Proposal Tests Critical Support
Market Pulse
- The price of JUP declined to $0.3398 and has lost 15.6% in November, closing in on support levels it hasn’t seen in half a year.
- Developers introduced instant unstaking at a 3% cost to improve liquidity, but the market remains in a downtrend.
- The RSI is in the oversold area at 41.1, and the ADX continues to show a strong trend with a value of 35.05.

The price action was unable to pivot until later in the week, rallying over 33% from the lows. The demand over those few days was virtually cut in half by two overhead resistance levels. If Jupiter is successful in crossing back above the 4-hour 21-EMA at $0.4158, there are two more resistance levels directly above. The first has been actively capping upside movements since August 20th and is located at $0.4397. The 50-EMA on the 4-hour chart is the following obstacle at $0.4618. Buyers will undoubtedly struggle to get across the 50-EMA since it has served as a reliable resistance level for almost a month.
| Metric | Value |
|---|---|
| Asset | JUPITER (JUP) |
| Current Price | $0.34 |
| Weekly Performance | -3.77% |
| Monthly Performance | -15.58% |
| RSI (Relative Strength Index) | 41.1 |
| ADX (Average Directional Index) | 35.1 |
| MACD (MACD Level) | -0.02 |
| CCI (Commodity Channel Index, 20-period) | -80.40 |
RSI at 41.1 Matches Levels Last Seen Before August’s 40% Rally
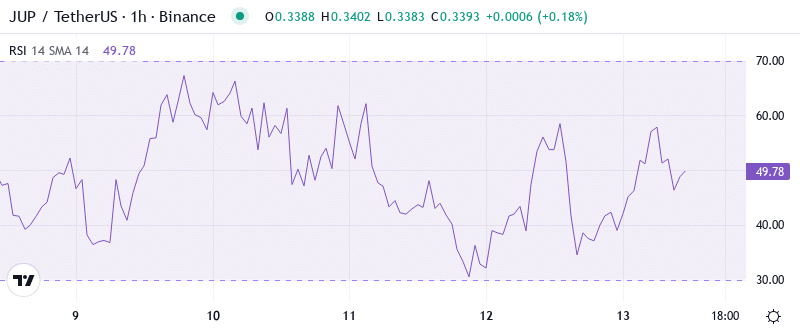
The daily RSI and Stoch RSI have approached historically low levels, which in the past have been good entry points for swing traders.
What is interesting to note is the behavior of RSI during the sudden unstaking news – rather than indicating divergence or strength, momentum kept on bleeding along with the price. Therefore, for swing traders, this oversold reading coupled with the proposed liquidity injections makes for a high-risk, high-reward scenario where measured accumulation might be rewarding if the support is maintained.
ADX Climbs to 35.05 – Conviction Behind the Downtrend
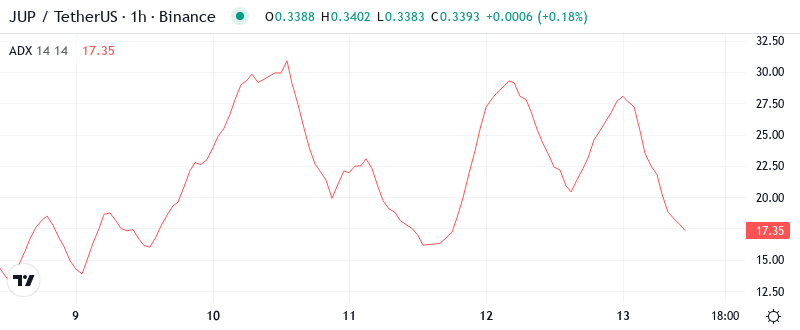
The ADX reading is very high and a good time to sell. It is the highest ADX level since May.
It means the current movement has real power. In simple terms, if ADX rises above 30 while the price is falling, it indicates that easy counter-trend bounces have played out. Day traders would do well to adjust to these conditions by allowing for confirmed reversals and not attempting to be heroes and catch a falling knife, particularly since the news of immediate unstaking didn’t flip the market dynamic right away.
20-Day EMA at $0.365 Becomes First Resistance Target
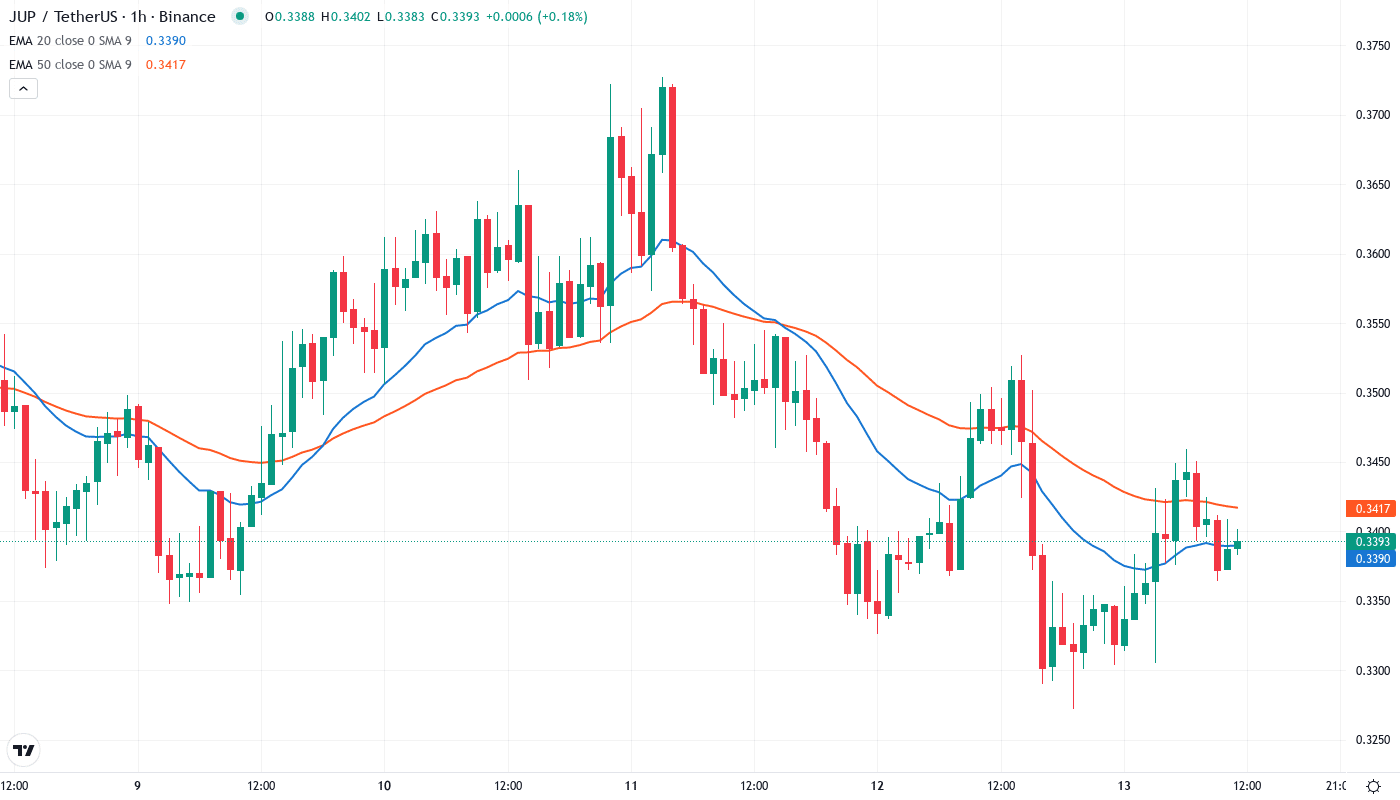
The only moving average of note on the daily chart is the 200-day EMA at around $0.218, which bulls defended on six separate occasions prior to December’s capitulation. That level is currently acting as a key support for the downtrend, and failure to hold such a pivotal level suggests that lower prices are imminent.
Even more worrying for Jupiter supporters would be a daily close below the 200-day EMA (in green), currently at $0.39. This average has not been tested since November, but the same cannot be said for the 50-day (white) and 100-day EMAs, which were blown through on the crash to yearly lows last week. A daily close beneath the 200-day EMA would be a terrible return to a downtrend currently forming on the daily chart.
Support at $0.315 Faces Sixth Test Since June
Buyers seem quite eager to accumulate JUP in this area, but it’s the lack of real bullish response following two weeks of declines that spell trouble for prospective longs. With that in mind, we would recommend waiting for a daily close back above the $0.04 level before considering bullish installations.
There is a lot of resistance at levels between $0.365 and $0.431. In fact, the longs that are trapped at these levels increased with every failed attempt to move higher in the month of December. The 20-day EMA is equally stationed at $0.365 which is likely to act as the initial resistance that the bulls will face. Short term traders can initiate long positions at $0.28 and keep a stop loss at $0.244.
Importantly, the market dynamics indicate a clear distribution phase, as lower highs have been printed since November, despite the highly anticipated increase in inflation caused by the exponential growth of the fiat money supply. This low-hanging fruit catalyst means that any marginally engaged institutional players likely used the news-driven liquidity to seek bids rather than offers, implying the broader downtrend remains firmly intact.
Bulls Need Decisive Close Above $0.365 to Shift Momentum
If JUP manages to reclaim and maintain the 20-day EMA at $0.365, it might create the first higher low since November and lead to a relief rally towards $0.396. Moreover, the continuous bid could be aided by stakers using the instant unstaking feature to rotate capital more readily.
If the $0.315 support fails to hold and is confirmed by volume, the price will likely fall quickly to the 200 EMA just under $0.31. This will trigger several stops/fresh short positions and the price is likely to fall very quickly to the $0.30 handle.
Based on oversold conditions coinciding with key support and a fundamental change in the market, the most likely short-term direction is consolidating between $0.315-$0.365 as the market assesses if immediate unstaking prompts organic demand or just accelerates selling.
