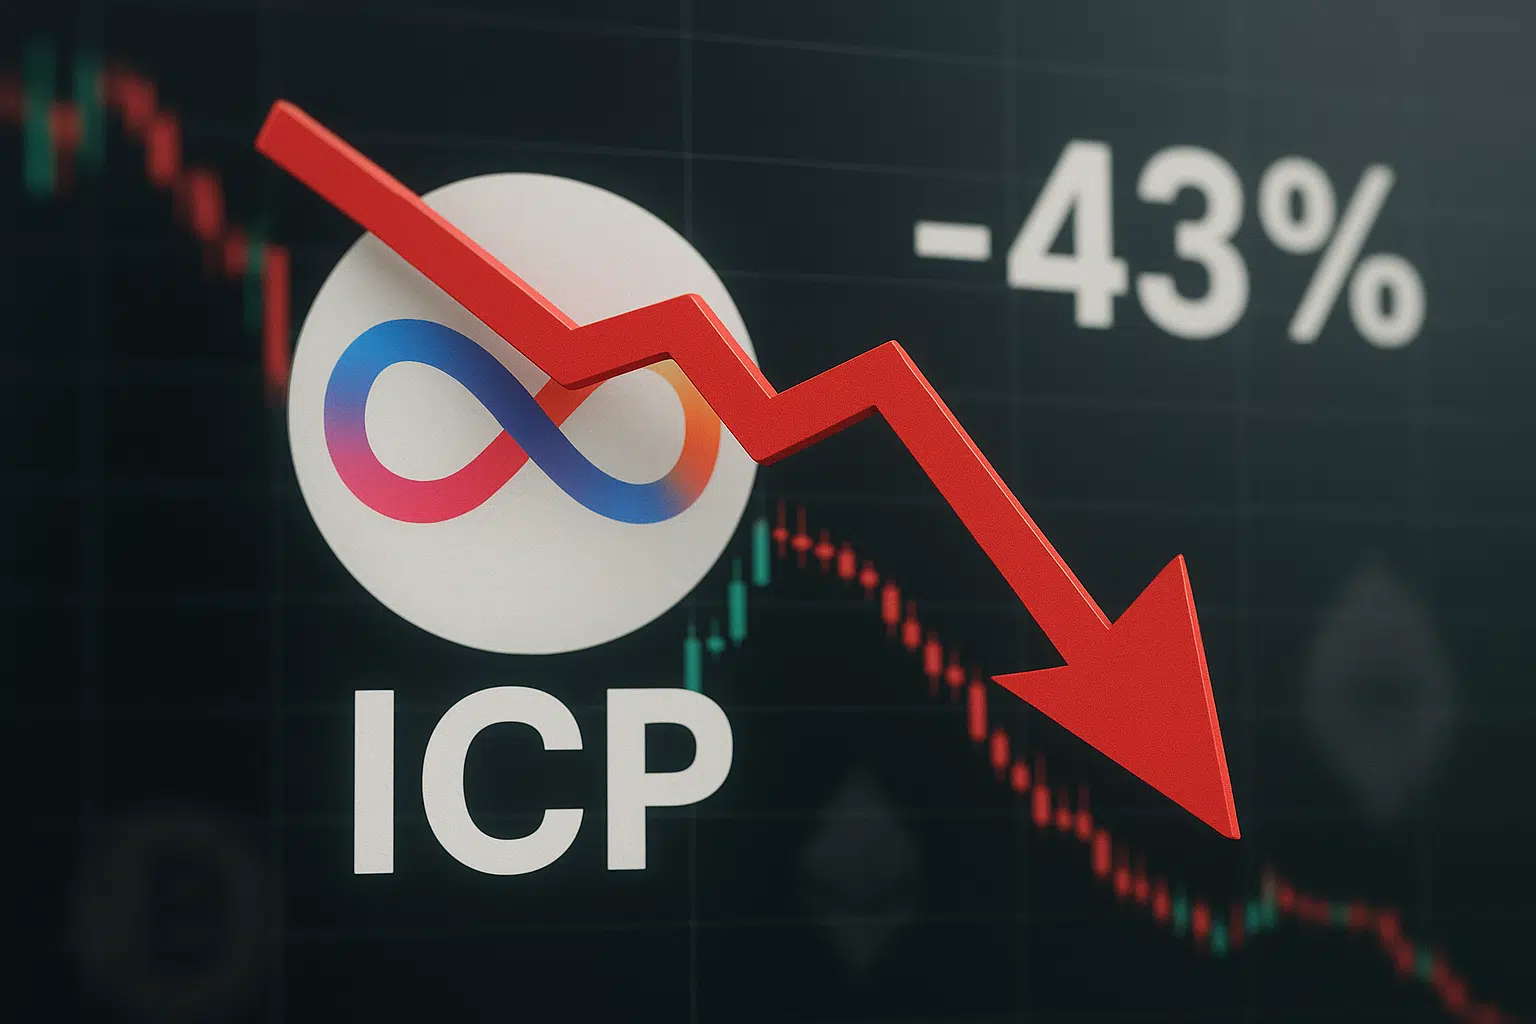
ICP Plunges 43% in December as Ecosystem Updates Fail to Halt Broader Crypto Rout
Market Pulse
- ICP devastated by 43.14% monthly drop despite major ecosystem innovations rolling out
- RSI at 38.27 signals oversold territory – matching levels from August’s capitulation phase
- Support architecture crumbles as price trades below entire EMA ribbon at $3.40
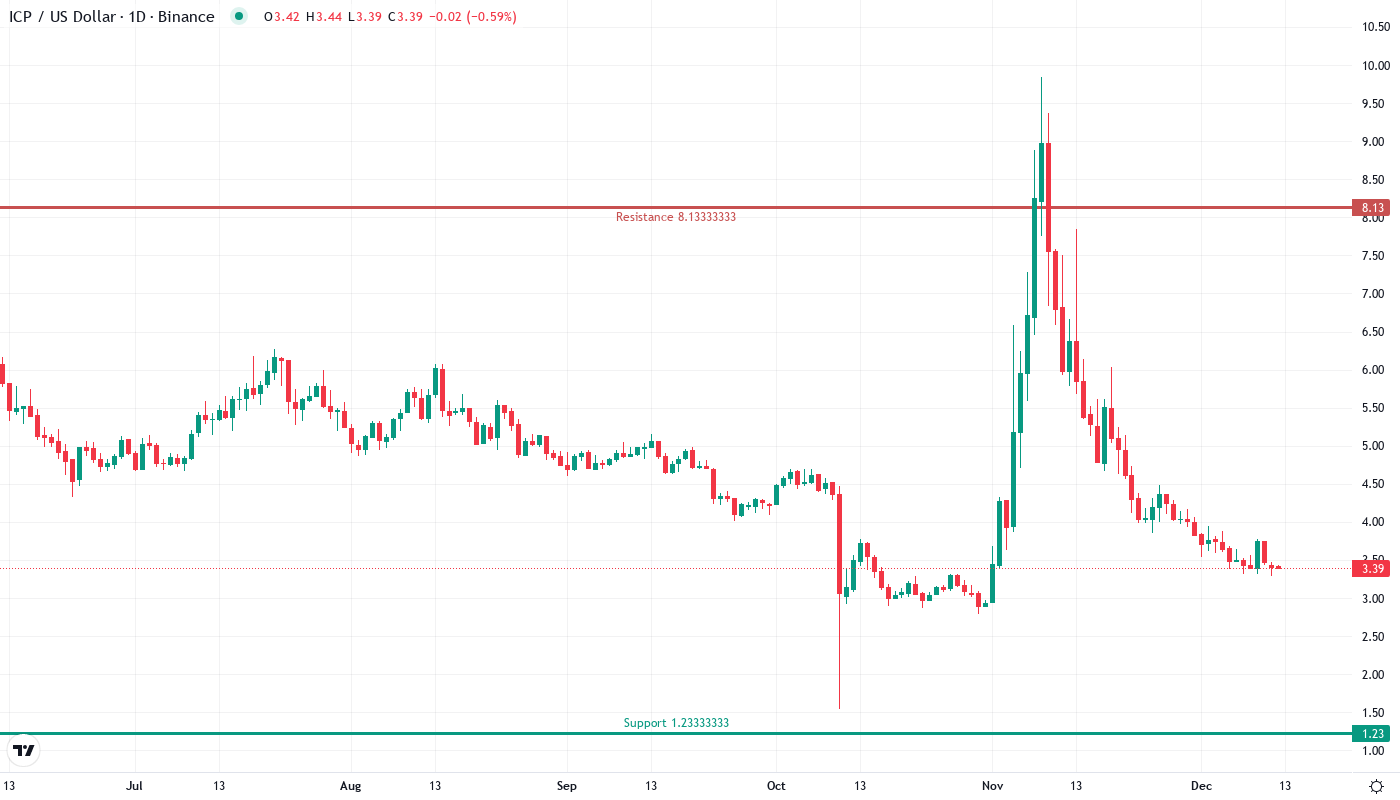
Internet Computer’s price action tells a brutal story this December, with ICP shedding 43.14% of its value in a devastating drop that erased months of gains. The collapse from monthly highs near $7.85 to current levels around $3.40 came despite significant ecosystem updates including AI tooling enhancements and expanded developer resources – underlining how macro headwinds overwhelmed positive fundamentals. The main question for traders is: has ICP found a floor at these oversold levels, or does further downside await as the broader crypto market continues its year-end washout?
| Metric | Value |
|---|---|
| Asset | INTERNET COMPUTER (ICP) |
| Current Price | $3.40 |
| Weekly Performance | -7.10% |
| Monthly Performance | -43.14% |
| RSI (Relative Strength Index) | 38.3 |
| ADX (Average Directional Index) | 12.4 |
| MACD (MACD Level) | -0.34 |
| CCI (Commodity Channel Index, 20-period) | -95.92 |
Momentum Exhaustion Signals Capitulation Phase Complete
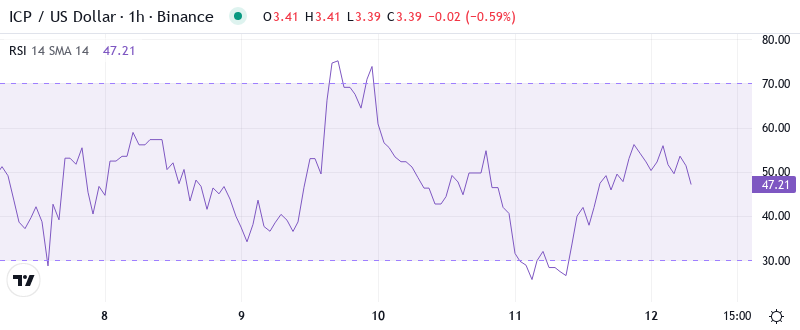
RSI sits at 38.27 on the daily timeframe, firmly in oversold territory after plunging from neutral readings above 50 just weeks ago. This marks the first time since August that momentum indicators have signaled such extreme seller exhaustion, and historically, similar RSI configurations preceded relief rallies of 15-25% within two weeks.
What’s revealing is how RSI behaved during the ecosystem announcement – it barely budged despite the positive news, confirming that technical selling pressure completely dominated any fundamental buying interest.
So for swing traders, this deeply oversold reading combined with the lack of further downside momentum suggests a technical bounce is overdue, though any rally will likely face heavy resistance from trapped longs looking to exit.
ADX at 12.42 Keeps Range Traders in Control
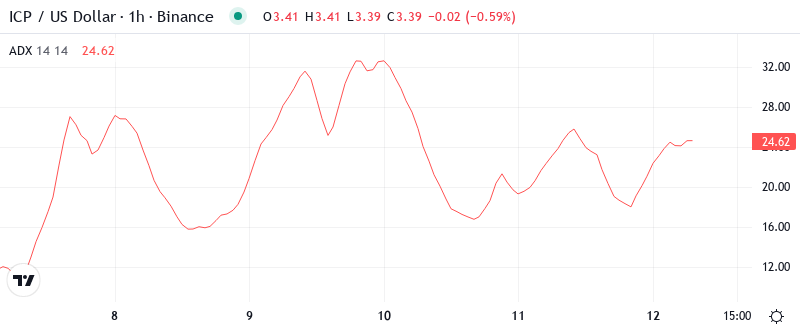
At the level of 12.42, the ADX entry indicates minimal trending conditions – essentially telling us the market has shifted from directional collapse to sideways chop. This sub-20 reading marks the lowest trend strength since October’s accumulation phase, suggesting the violent downtrend has exhausted itself for now.
Looking at trend strength patterns, this compression phase typically lasts 2-3 weeks before the next directional move emerges. Therefore, day traders should adjust their strategies from trend-following to range-bound tactics, focusing on buying support near $3.29 and selling resistance around $3.80-$4.00 until ADX climbs back above 25 to signal renewed trending conditions.
Price Trapped Below Entire EMA Cloud Since Mid-December
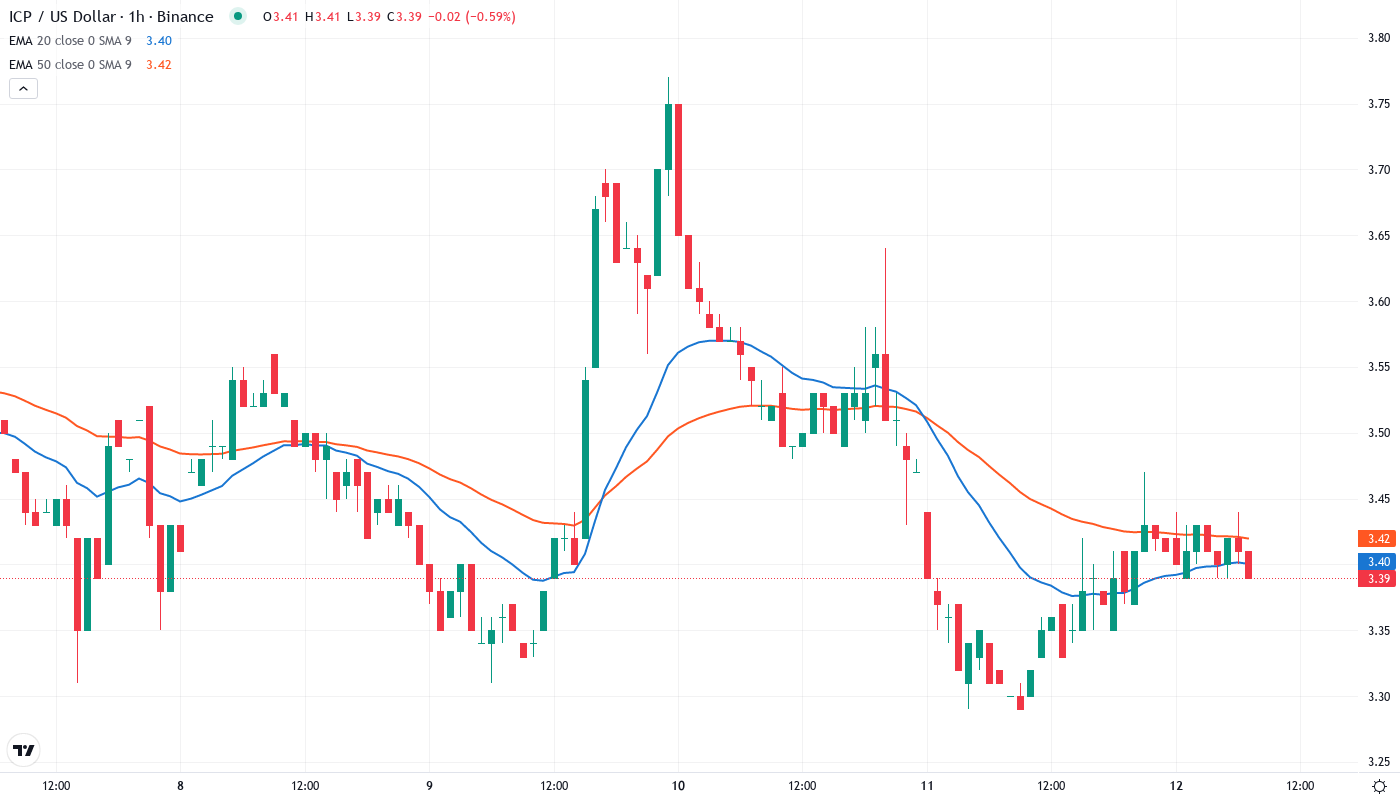
Price action through the EMA ribbons paints a bearish picture, with ICP trading below all major moving averages. The 10-day EMA at $3.57, 20-day at $3.83, and critically the 50-day EMA at $4.20 all now act as stacked resistance levels that bulls must reclaim to shift the structure bullish.
Most telling is the compression between the shorter-term EMAs – they’ve converged into a tight band between $3.57-$3.83, creating what amounts to a resistance wall that rejected two relief rally attempts this week. The 200-day EMA sits distant at $13.17, so far above current price that it’s essentially irrelevant for near-term trading decisions. This configuration suggests any bounce will struggle to break above $4.00 without a fundamental catalyst.
Support Architecture Builds From $3.29 to $2.80
Above current price, sellers have stacked formidable resistance between $3.80 and $4.20, where the EMA cluster meets December’s breakdown level. The monthly pivot at $4.67 looms as major resistance if bulls somehow manage to reclaim the 50-day EMA, but that scenario looks distant given current momentum.
Bulls defend the monthly low at $3.29 as the immediate support line, with six touches in the past two weeks building a case for this level as reliable near-term floor. The Revolut and Trust Wallet integration news provided some buying interest at these levels, though not enough to spark a meaningful reversal.
Crucially, the price architecture shows a clear support shelf between $3.29 and $2.80, with the latter marking 2023’s accumulation zone. Any weekly close below $3.29 would likely trigger stop-loss cascades targeting that deeper support, potentially flushing out the remaining leveraged positions before a sustainable bottom forms.
Bulls Need Reclaim of 20-Day EMA to Shift Momentum
Should price reclaim and hold above the 20-day EMA at $3.83, it would mark the first positive technical development in weeks and open potential for a relief rally toward $4.20-$4.50. The ecosystem updates provide fundamental backing for such a move, but bulls need to prove they can defend higher levels first.
The bearish scenario triggers if ICP loses the $3.29 support on volume – this would trap recent bottom-fishers and likely cascade toward $2.80 or potentially the psychological $2.50 level. Given the lack of buying interest despite positive ecosystem news, this breakdown scenario carries meaningful probability.
Taking into account the deeply oversold RSI, non-trending ADX, and proximity to major support, the most likely near-term path is for ICP to consolidate between $3.29-$3.80 while building a base for the next directional move. Traders should watch for ADX expansion above 25 as the signal that this compression phase is ending.