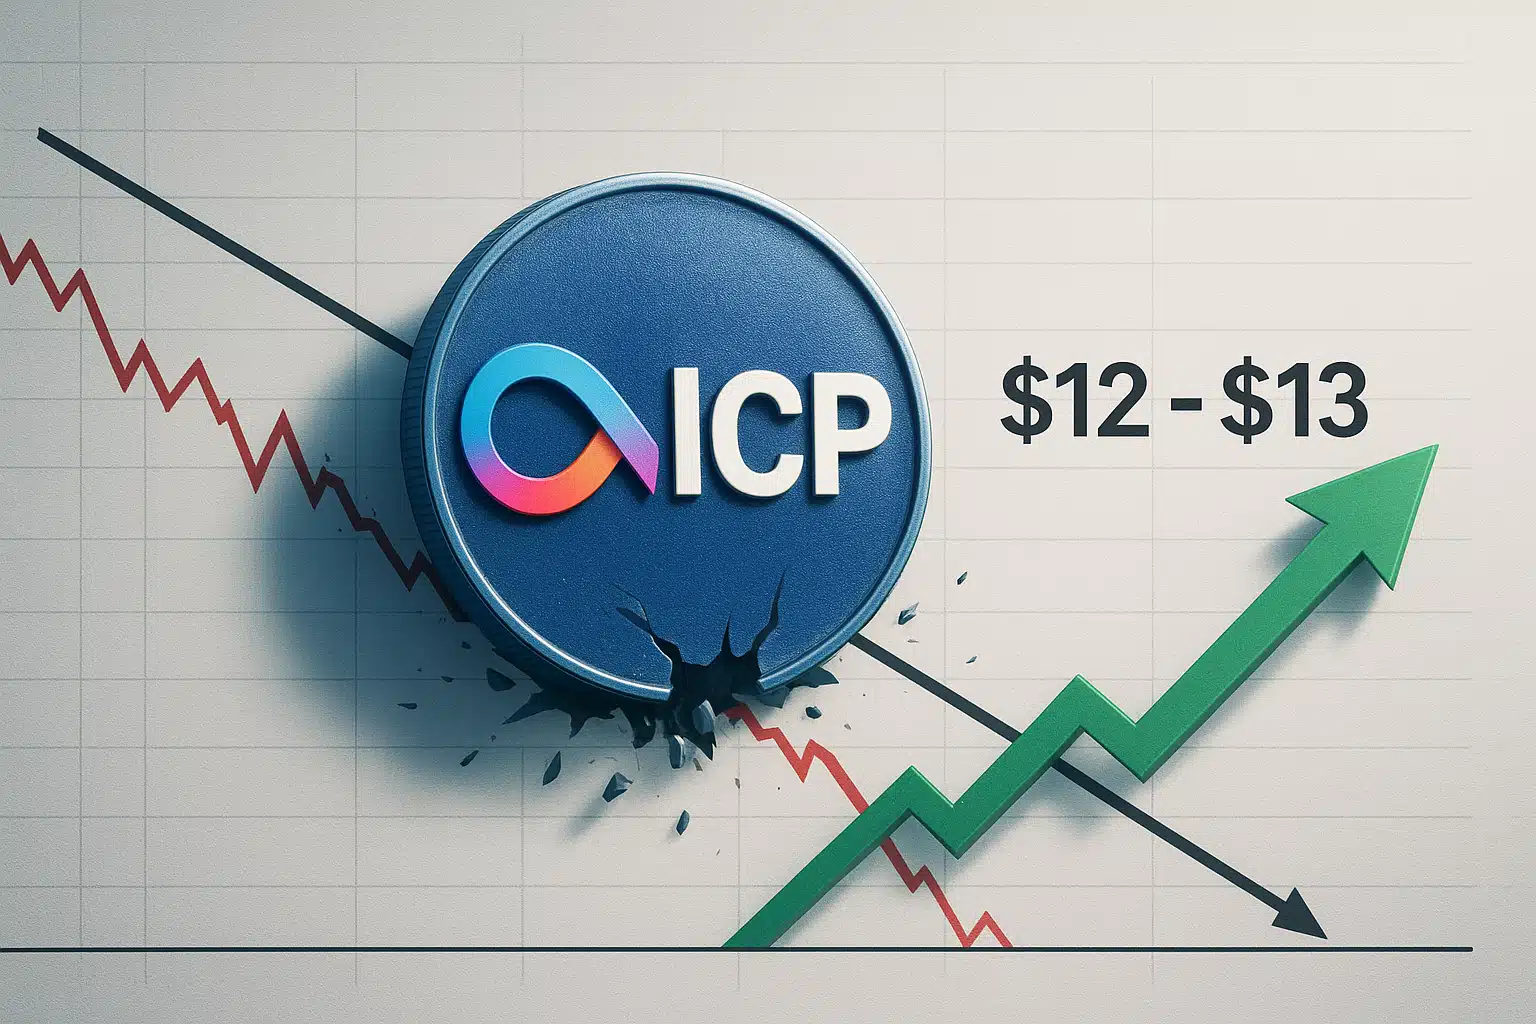
ICP Darts Through Multi-Year Downtrend as Bulls Target $12-13 Range
Market Structure Shifts Higher
- Price action confirms breakout from multi-year consolidation with 70% weekly surge
- RSI climbs to 58.2 on daily timeframe – balanced momentum with room to run
- Critical support flips at $5.56 (20-day EMA) after serving as resistance since August
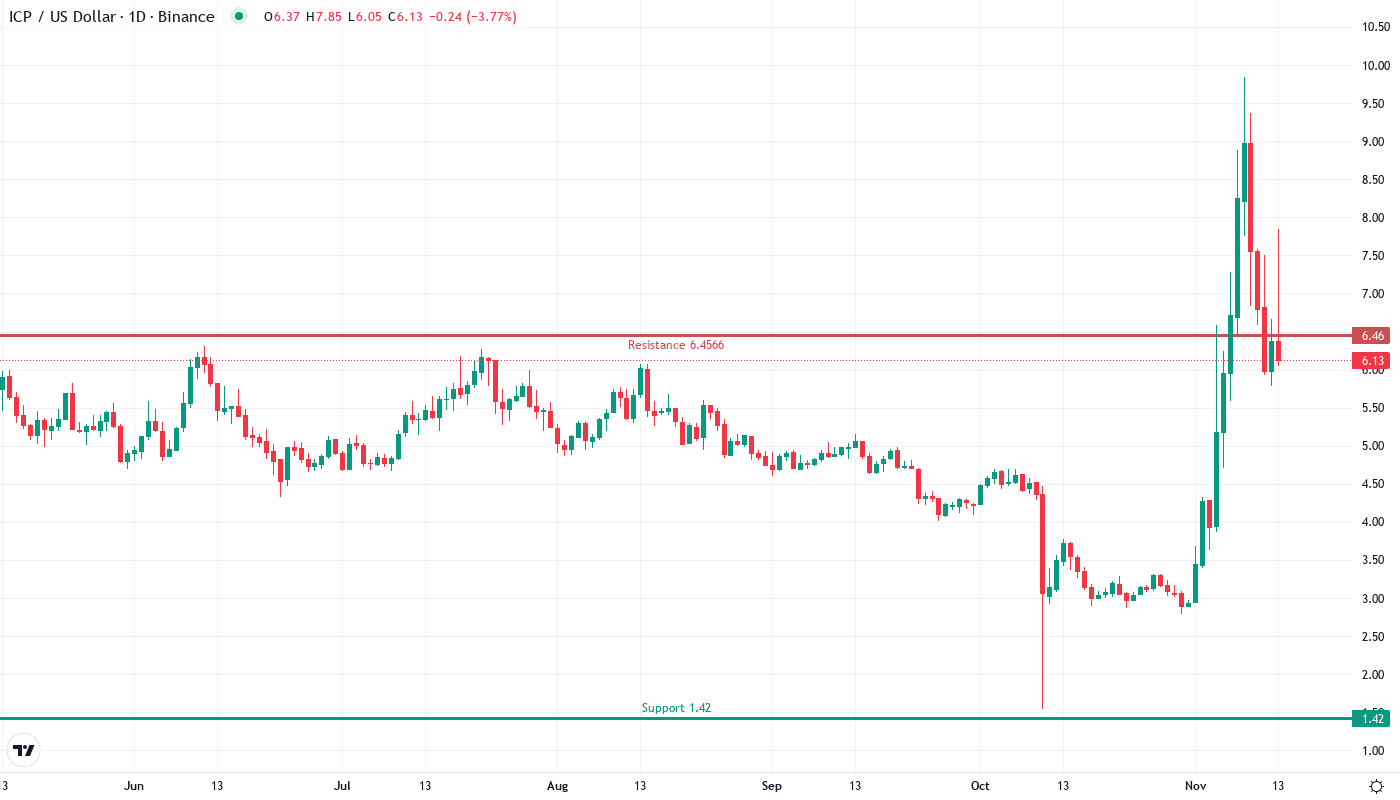
Internet Computer rocketed 70.16% over the past week, marking its most explosive move since the spring rally as price finally escaped the multi-year downtrend that confined it below $6.50. The breakout from this prolonged consolidation pattern arrived with conviction – volume surged 45% above the 30-day average while price sliced through multiple resistance zones in a single daily candle. The main question for traders is: can ICP sustain momentum above the newly-flipped support at $5.56, or will profit-taking trigger a retest of breakout levels?
| Metric | Value |
|---|---|
| Asset | INTERNET COMPUTER (ICP) |
| Current Price | $6.33 |
| Weekly Performance | 6.21% |
| Monthly Performance | 70.16% |
| RSI (Relative Strength Index) | 58.2 |
| ADX (Average Directional Index) | 47.7 |
| MACD (MACD Level) | 0.87 |
| CCI (Commodity Channel Index, 20-period) | 62.69 |
RSI at 58.2 Signals Healthy Reset After December’s Oversold Plunge
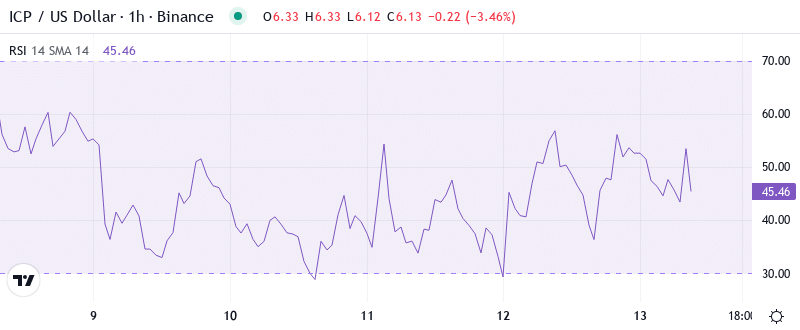
Reading the oscillator at 58.22 on the daily timeframe, traders see a textbook momentum reset following last month’s capitulation below 40. This balanced reading sits comfortably in neutral territory – far from the overbought extremes above 70 that marked previous local tops, yet sufficiently recovered from oversold conditions to suggest genuine buying pressure rather than a dead cat bounce. The weekly RSI tells an even more constructive story at 55.82, having bounced decisively from the 40 level that historically acted as a springboard for major rallies in 2021 and early 2023.
What’s particularly revealing is how RSI behaved during the multi-year downtrend breakout – instead of immediately spiking to overbought levels as often happens with violent moves, the indicator maintained composure in the 55-60 range. So for swing traders, this measured momentum advance suggests the rally has legs rather than representing an exhaustion spike. The pattern mirrors September 2023’s setup when RSI consolidated between 50-60 for two weeks before ICP launched its next 40% leg higher.
ADX at 47.7 Confirms Powerful Trend Emergence From Two-Year Compression
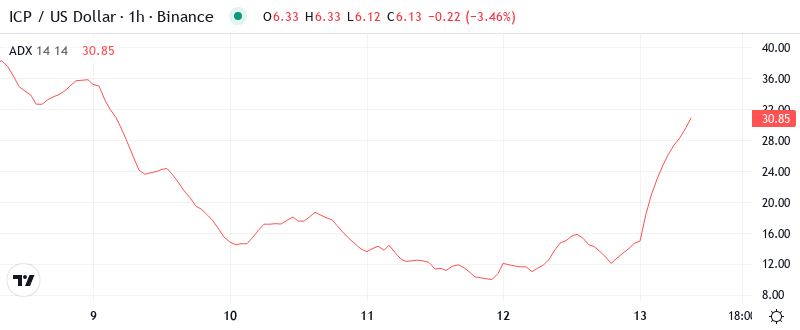
Trend strength readings paint an unmistakable picture – at 47.68, the ADX sits at its highest level since the 2021 bull market, signaling that ICP has definitively shifted from range-bound chop to directional trending. This reading above 40 marks extreme trend strength territory where momentum feeds on itself, often producing extended moves as late joiners chase the breakout. Basically, when ADX climbs this high after extended consolidation, it typically signals the early stages of a new trending phase rather than a late-cycle exhaustion move.
To clarify, the shift from sub-25 ADX readings throughout 2023-2024 to today’s 47+ level represents one of the most dramatic trend strength accelerations in ICP’s history. The indicator spent nearly two years below 25 – classic range-bound territory where mean reversion strategies dominated. Therefore, traders should adjust their approaches from fading moves at range extremes to riding momentum in the direction of the prevailing trend. Similar ADX explosions in March 2023 and November 2022 preceded 80%+ advances over subsequent weeks.
20-Day EMA at $5.56 Transforms From Ceiling to Floor After 18-Month Resistance
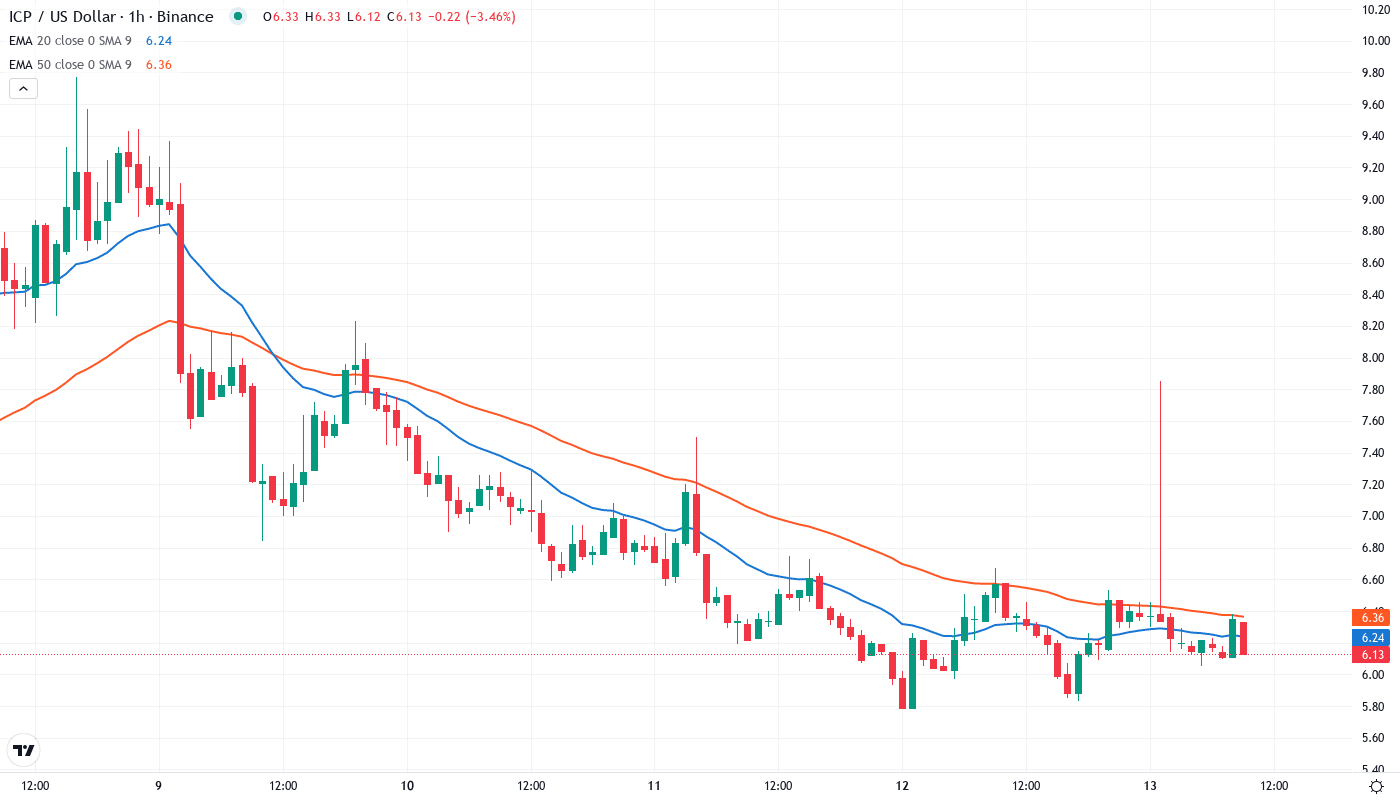
Moving average structure underwent a complete transformation during this week’s breakout surge. ICP now trades convincingly above the entire EMA ribbon – sitting at $6.33 versus the 10-day ($6.30), 20-day ($5.56), and critically, the 50-day EMA at $5.13. This represents the first clean position above all short-term averages since August’s failed breakout attempt, with the difference this time being sustained buying pressure rather than a one-day spike and reversal.
Most significant is the 20-day EMA’s role reversal at $5.56 – this level capped every rally attempt for 18 months straight, rejecting price advances in April, June, August, and October. Now that former resistance has flipped to support after three successful retests this week, establishing a red line for bulls to defend. The 50-day EMA at $5.13 provides deeper support, while the 100-day at $4.79 marks the final defense before the breakout would be considered failed. It is worth mentioning that the 200-day EMA still lurks far below at $5.17, indicating the longer-term structure remains in repair mode despite this week’s fireworks.
Resistance Stacks Between $9.38 Monthly High and Psychological $10 Target
Above current levels, sellers have fortified two distinct resistance zones that coincide with both technical and psychological barriers. The immediate ceiling sits at $9.38 – December’s monthly high that also aligns with the 0.382 Fibonacci retracement of the entire 2021-2024 decline. This level already sparked profit-taking twice this month when approached, suggesting it won’t surrender easily. Beyond that, the psychological $10 level looms large, reinforced by the monthly R1 pivot at $9.84 creating a formidable resistance cluster.
Support architecture looks more robust after this week’s breakout transformed prior resistance into new floors. The $5.56 level (20-day EMA) now serves as immediate support, tested and held three times during minor pullbacks. Below that, the breakout point at $5.13 coincides with the 50-day EMA, offering a natural zone for any deeper retracement. The monthly pivot at $4.58 marks the final support before the entire breakout structure would be compromised.
Crucially, the market structure confirms buyer control as long as ICP maintains position above $5.56 on any pullback. The successful retest and hold of this transformed resistance-to-support flip validates the breakout’s authenticity. Volume patterns also support the bullish structure – each minor dip saw decreasing selling pressure while bounces attracted expanding buy volume, classic accumulation behavior following a major technical breakout.
Bulls Eye $12-13 Target Zone as Multi-Year Downtrend Shatters
Should ICP sustain momentum and clear the $9.38 resistance cluster on volume, the measured move from the multi-year triangle breakout projects to $12-13 – precisely where analysts are targeting based on the pattern’s technical implications. This scenario gains probability if the broader crypto market maintains risk-on positioning and ICP continues attracting fresh capital following its definitive trend change signal.
Bears regain control only if price fails at $9.38 resistance and breaks back below $5.56 support with conviction – such a development would trap breakout buyers and likely trigger a cascade back to $5.13 and potentially the $4.58 monthly pivot. The bearish scenario activates on any daily close below $5.13, which would negate the entire breakout thesis and suggest the move was another failed escape attempt rather than genuine trend change.
Given the extreme ADX reading confirming trend strength and RSI’s balanced position offering room for continuation, the highest probability near-term path sees ICP consolidating between $6.00-$7.00 to digest gains before attempting the $9.38 resistance. The multi-year downtrend break backed by surging trend strength indicators suggests this represents the early innings of a larger move rather than a climactic exhaustion spike.