Hyperliquid Tumbles 33% as Token Unlocks Trigger Cascade Below Critical Support
Market Structure Shifts Lower
- The token unlocks had an amplifying effect on HYPE’s downturn.
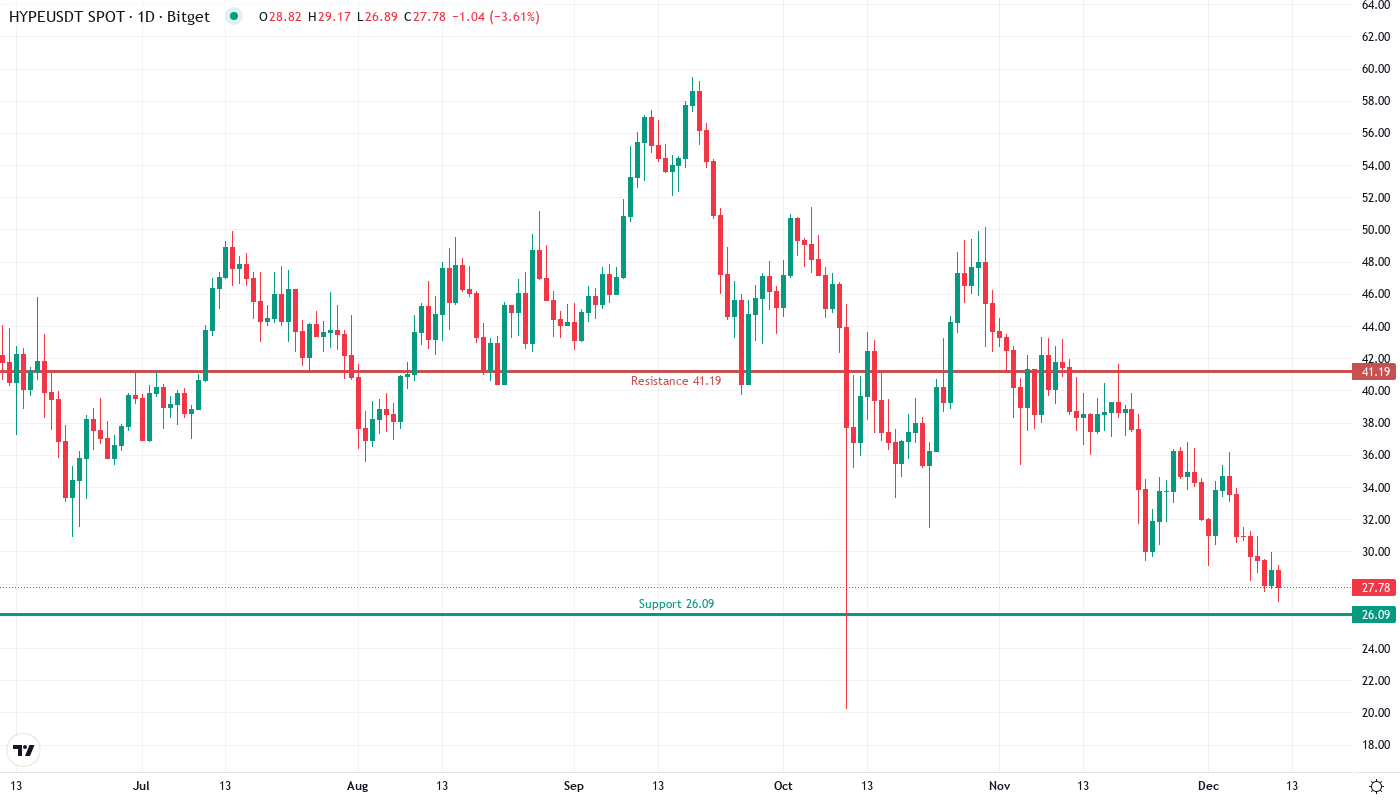
- In a month, the price dropped by $13.70, going through several important weekly levels.
- The rejection of the monthly untested level led to the liquidation of the weekly demand and the confirmation of the break of the hyper weekly demand trend line.
The weekly structure has also turned bearish when the last high was taken out and confirmed on the closing basis.
The HYPE token, unlocking gradually but constantly, has pressured the price, despite the team already relocking the most substantial portion, announced on the Hyperlaunch app to be relocked for 2 more months, reducing the unlock number by +32k HYPE for each month (total -65k HYPE). The relock data was recently updated and pushed the unlock number down per the two month relock period post-dev. The HYPE token is also burning 1% of the supply monthly as all of the paid products on the platform this past month were paid in the HYPE token.
| Metric | Value |
|---|---|
| Asset | HYPERLIQUID (HYPE) |
| Current Price | $27.90 |
| Weekly Performance | -19.57% |
| Monthly Performance | -32.67% |
| RSI (Relative Strength Index) | 34.4 |
| ADX (Average Directional Index) | 25.8 |
| MACD (MACD Level) | -2.43 |
| CCI (Commodity Channel Index, 20-period) | -135.71 |
Momentum Exhaustion Confirms at 34.38 – Matches Pre-Breakdown Configuration
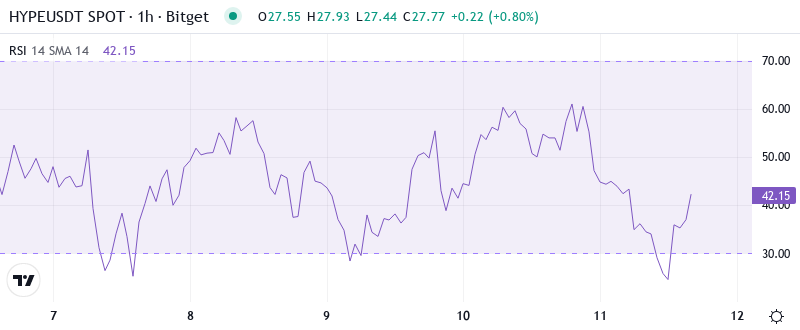
The Relative Strength Index, or RSI, measures the speed and change of price movements. The RSI oscillates between zero and 100. Traditionally the RSI is considered overbought when above 70 and oversold when below 30.
What is noteworthy is the behavior of RSI in those relief rallies. The RSI barely achieved a level above 40 before the subsequent rollover confirmed that sellers had exploited the strength to unload their positions. For swing traders, the continued weakness of the RSI below the 50 centerline implies that counter-trend long positions are still premature and an RSI level above 40, ideally recapturing the 50 critical levels bullish control required.
ADX at 25.82 Signals Trend Acceleration From December’s Range
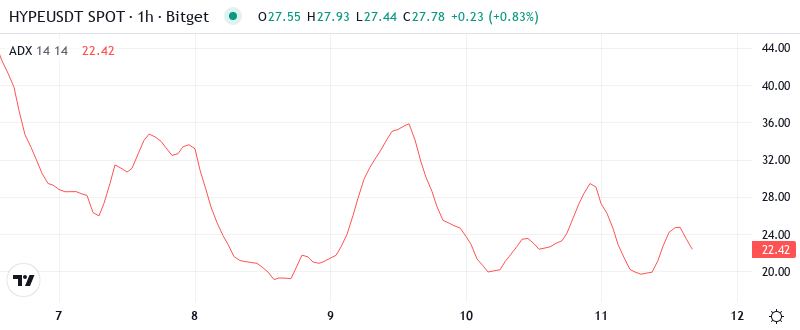
When broken down, the DI’s show the incremental selling pressure that eventually overwhelmed recent demand. The -DI slipped beneath +DI for the first time since the volatile November action, the +DI peaked at a lower level than the previous two rallies and the -DI+ value rose to its highest point since early September. Despite the negative price action, however, this is still suggestive of a longer and steadier decline rather than the instant collapses we witnessed in late August and September. The 5-day EMA is starting to diverge from the 13-day EMA for the first time in a month though, a sign of possible weaker pricing ahead.
To put it simply, this ADX setup implies that we’re in the “meat” of a trend rather than towards the end of it. In the past, HYPE’s downtrends haven’t shifted until ADX pushed above 35-40, indicating that sellers were “done.” So day traders will want to adjust and play for continuations lower, rather than trying to catch a bottom, and accumulators will want to wait for ADX to spike and roll from extremes.
20-Day EMA at $32.16 Caps Rally Attempts After Support Flip
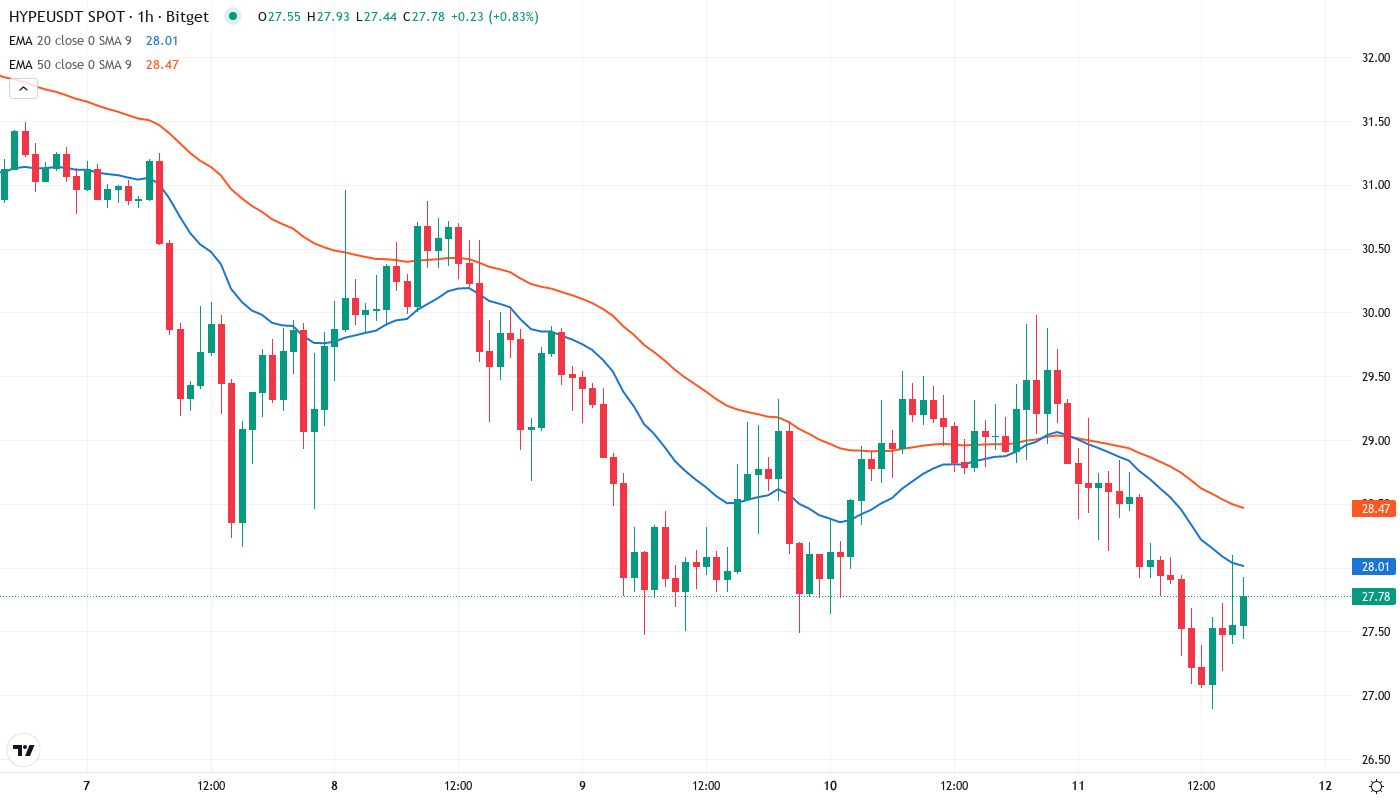
The HYPE price-action through the EMA ribbons paints a vivid picture of structural degradation. Currently trading substantially below the complete moving average stack, the 10-day EMA (30.19) and 20-day EMA (32.16) have now turned dynamic resistance having previously propped up the price during November’s sideways consolidation. However, it’s the 50-day EMA (38.61) that clearly failed as support following the panic of unlock selling.
The compression between shorter-term EMAs has expanded dramatically, with the 10-day accelerating lower away from the 20-day in a sign of increasing bearish momentum. The former support zone around $32 where the 20-day EMA sits now transforms into the first major resistance bulls must reclaim to even begin discussing a trend reversal. Until then, each EMA above current price represents another layer of overhead supply from trapped longs.
Psychological $30 Level Becomes Resistance as Support Architecture Crumbles
There is now heavy resistance between $30.19 (10-day EMA) and $35.29 (monthly pivot R1), with the psychological $30 level being particularly heavy after it was lost as support and turned into resistance on heavy volume. The December highs at $41.63 must now seem a long way off; they are 49% higher and would currently require a gap-fill on the daily chart.
The support structure seems quite weak as many key levels have collapsed one after the other. While initial support is at $26.09 (the monthly pivot S1), the key test arrives at the $25 handle, a level not retested since the beginning of December. If that gives way, the floor seems wide open until $20.19 (monthly S2), with that being a 50% retracement off the record peaks, meaning most of the weak hands would likely exit by then.
The market conditions have turned bearish following a pattern of lower highs and lower lows being confirmed by price and momentum indicators. The technical breakdown, persistent unlock pressure, and liquidation cascades taking place on Hyperliquid’s platform form a self-reinforcing loop in which every recovery only invites more sellers instead of actual buyers. It’s not just a regular downward price movement that comes in a bullish market context, it is a structural bearish phase that you need to withstand.
Bears Control Until $32 Reclaim – Target $20 on Confirmed Breakdown
In order to indicate that the downtrend has paused, the bulls need a daily close above $32.16 (20-day EMA) and follow-through buying above $35. Barring that, the current bounce is likely to be used by longs to the exit as unlocking continues to depress the price. The extent of the technical damage would imply that constructive price action will not be forthcoming for an extended period of time and/or after a full-fledged position reset.
If HYPE breaks $50, the next logical area would be $40. If $40 gives way, $30 seems the final destination. On the upside, $60 could create a stop-run and set up further gains.
Given the current highly-risk off market environment and continued unwind of the long-risk momentum/factor trade again this week, we reduce our most optimistic bull case to $65 if the token can meaningfully rally subsequent to a near-term bottom and before unlock acceleration becomes a relevant focus. Systemically, there are no changes to our view. HYPE’s success in converting brand sponsorship into sustainable revenue is encouraging but we view the odds of growing into its current fully-diluted valuation as low. Two other unlock events are on the horizon and should continue to pressure price action if fundamental catalysts are lacking, particularly when even applying a simple-on paper, non-diluted valuation/math.