Hyperliquid Surges 11.8% as Token Burn Approval Sparks Rally Toward $40

Market Structure Shifts Higher
- The HYPE token price increased by 11.8% to $25.14 after announcing a significant token burn to tackle supply issues.
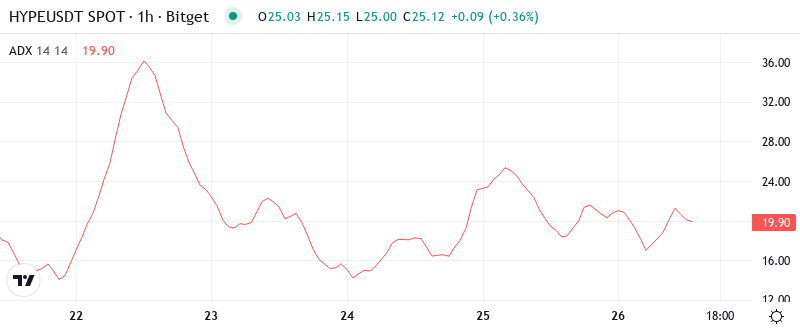
- The ADX spiked to 35.87, reflecting a power-up in trend strength since the December compression stage.
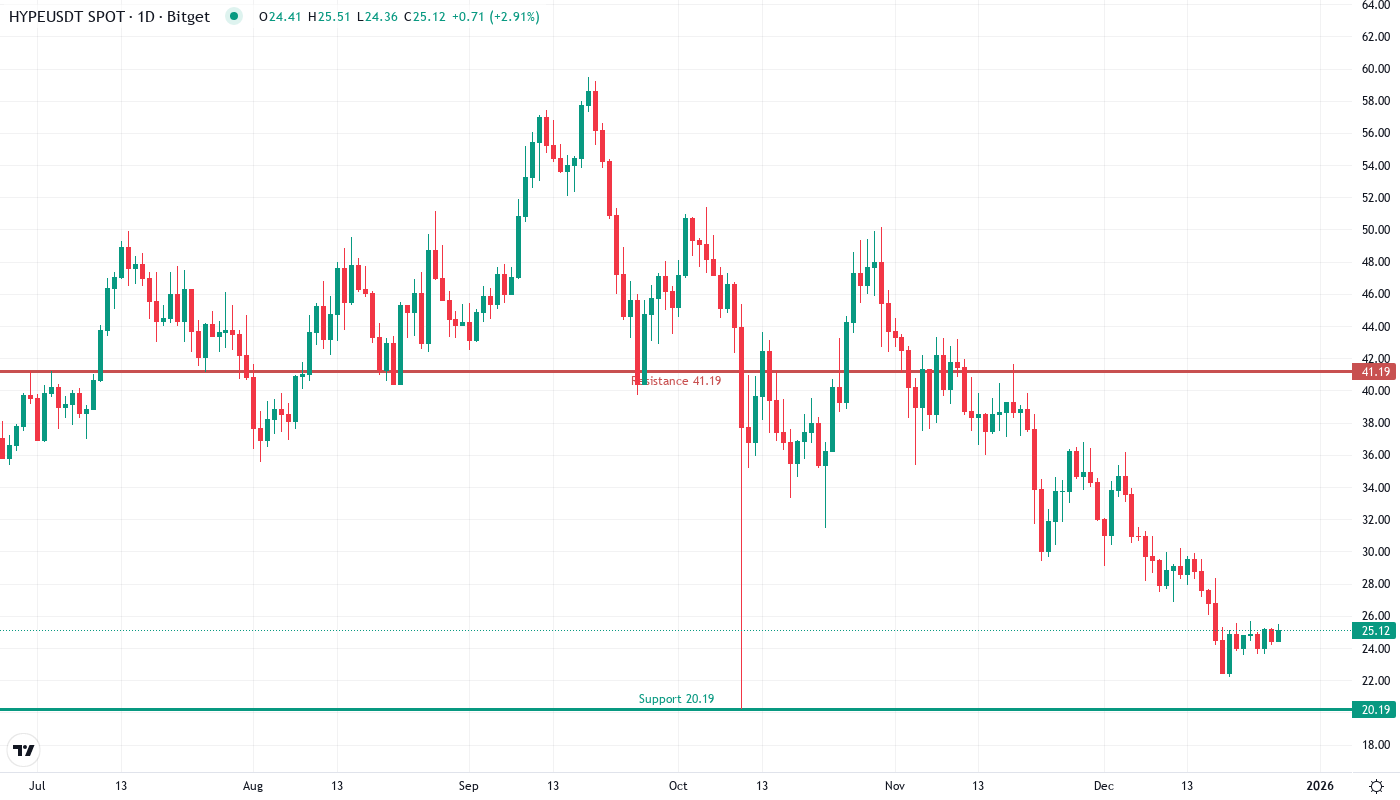
- Bulls are defending crucial support at $22.22 and eyeing resistance in the $31–$36 range.
The news was well received, as 98% of voters in Hyperliquid’s governance pool opted to approve the proposal to burn the “remaining unissued portion of the initial supply.” The idea elicited a very enthusiastic response from the community, who interpreted this as a direct and viable solution to the deep-seated oversupply problem. As $HYPE endeavors to scope out previously uncharted price territory in search of new all-time highs (ATHs), the upswing begins to make the conversation a possibility as technical developments can catalyze further activity within the blockchain.
| Metric | Value |
|---|---|
| Asset | HYPERLIQUID (HYPE) |
| Current Price | $25.14 |
| Weekly Performance | 11.83% |
| Monthly Performance | -25.47% |
| RSI (Relative Strength Index) | 40.4 |
| ADX (Average Directional Index) | 35.9 |
| MACD (MACD Level) | -2.30 |
| CCI (Commodity Channel Index, 20-period) | -52.28 |
Momentum Resets to 40.4 After Three-Month Capitulation Phase
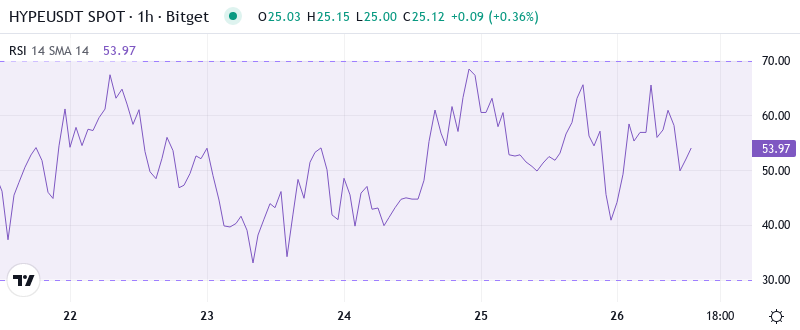
The Relative Strength Index is a momentum oscillator that measures the speed and change of price movements. RSI oscillates between zero and 100. Traditionally, and according to Wilder, RSI is considered overbought when above 70 and oversold when below 30. Negating a 50% momentum reading as we have now is generally regarded as a no-man’s land of indecision, but for the purposes of this chart history, we’re taking it to mean a bear trend.
What is interesting to note is the behavior of the RSI on the way down and the bounce back up. During the three-month decline from the high of $36.77 to the December lows, the RSI was below 40 for an extended period of time which shows that the selling was persistent. Hence, for a swing trade, this move above 40 is the first real reset of momentum since October but a move over 50 is really required to confirm the thesis that a reversal is taking place.
ADX at 35.87 Signals Trend Followers Should Pay Attention
With an average true range of up to two points, bear in mind that we could easily see 10% pops and drops here given HYPE’s highly volatile nature. The only play warranted is on the trend side in that context, but fading extremes of the price range itself.
In simple words, we are moving from a situation in which the mean reversion strategy used to work well, to a new one in which the momentum strategy will have an edge. This means that, as the ADX goes over 30, fading the market will become more and more dangerous; but at the same time, the trend-following approach with a trailing stop will become a higher probability strategy.
20-Day EMA at $26.77 Becomes First Major Test for Bulls
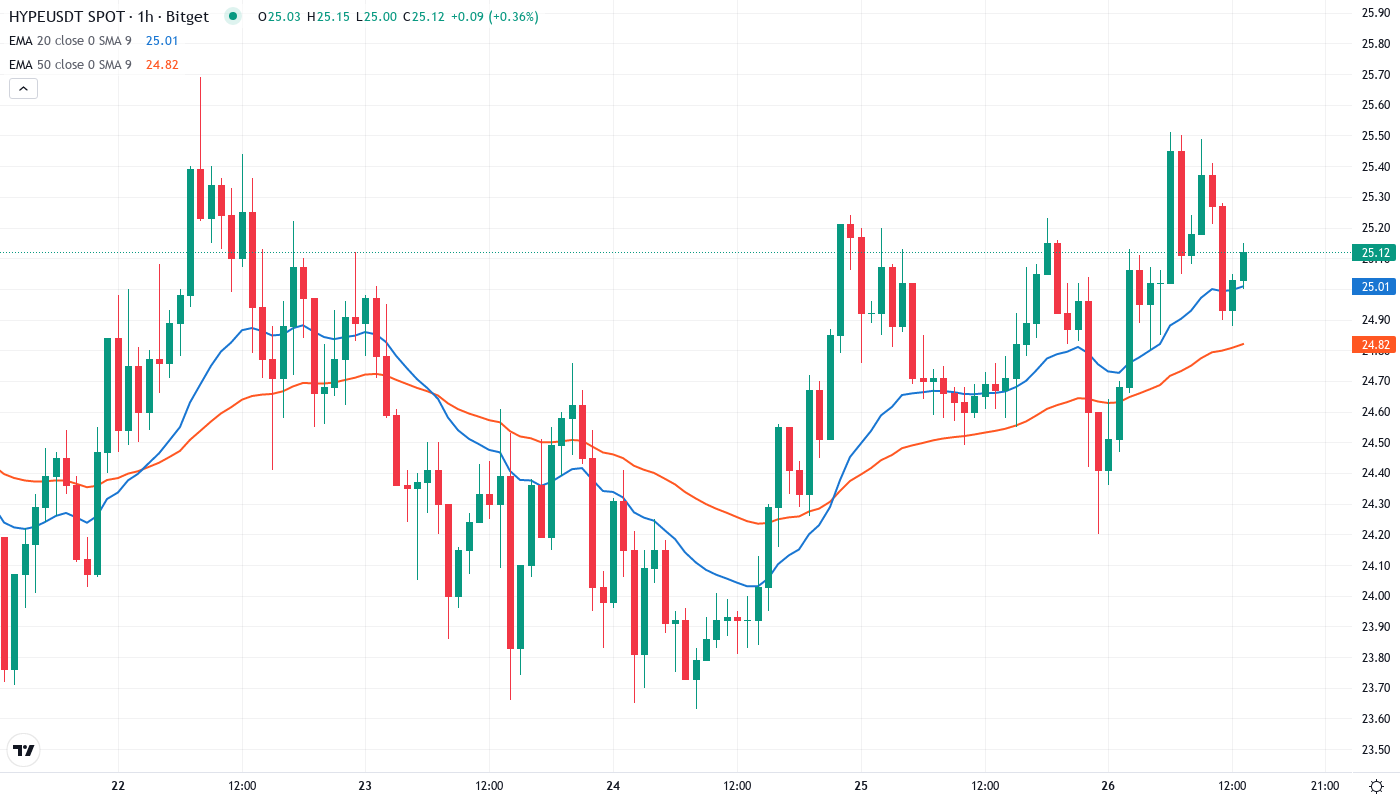
The EMA ribbons suggest this level could once again act as a barrier, although budding support is also evident with the bands tightening and moving upwards. Eyes will lock north on the 20-DMA and the $30 psychological barrier that suppressed the late December highs.
When we consider the wider moving average perspective, the 50-day EMA at $31.23 and 100-day at $35.25 construct a potent resistance cluster between $31–$36 – directly on the monthly peaks. Formerly, that support from November turns into resistance and gives bears something to protect, particularly because the token burn blocks part of the offer while shoring.
Resistance Stacks Between $28.42 and $36.21 as Bulls Face Gauntlet
The first hurdle for bulls is at $28.42, which is the 20-day EMA on the weekly chart and the $30 handle. This area capped two rallies in the beginning of December, albeit neither of them was accompanied by the hype of a significant coin burn.
The current weekly low, achieved very early in the week, is a typical bullish reaccumulation level that a.) purges over-leveraged, impatient, or weak-handed positions, and b.) induces high-profit, high-conviction holders to increase their positions at the best possible price.
Importantly, as long as buyers hold $22.22 on any pullback, the market structure suggests their efforts are paying off and that increases in decentralised exchange (DEX) volumes outweigh all bearish perspectives. Hence, over the coming month, it would take a break below $22.22 to revert our view. That said, it’s clear first-quarter earnings were weighed down by an ill-timed insider spending and those insiders likely regained approval to sell at higher levels.
Token Burn Catalyst Opens Path to $40 If Bulls Clear $31 Resistance
For the trend to turn favourable to the bulls, they would need a clear daily close above $31.23. Their target would be $40, a level highlighted by analysts after the burn news. With supplies on the decline and DEX expansion unabated, a solid demand above the 50-day EMA may confirm that stance.
The trade wouldn’t work if HYPE hard floors at $28.42 and then falls back under $22.22 with conviction—a play that would ensnare chasers of postburn hype and possibly force selloffs into $20. Any increase in insider short interest fears or uptrend in DEX swaps heat from regulators might push that sequence.
Based on the technical setup and underlying drivers, the most likely immediate trajectory has HYPE ranging in the $24-$28 area as it absorbs recent advances before challenging the $31 level. The diminished token volume establishes a lopsided risk-reward ratio in the longs’ favor, though the $31 level where previous advances have been thwarted needs to be acknowledged by traders.