Hyperliquid Reclaims $28 After Devastating 47% Drop From December Highs
Market Structure Shifts Higher
- HYPE bounces 12% from weekly lows after treasury announces $30M buyback program
- Cross-chain USDC integration and leveraged stablecoin trading expand platform utility
- Price action convincingly breaks above 20-day EMA at $27.06 on strong volume
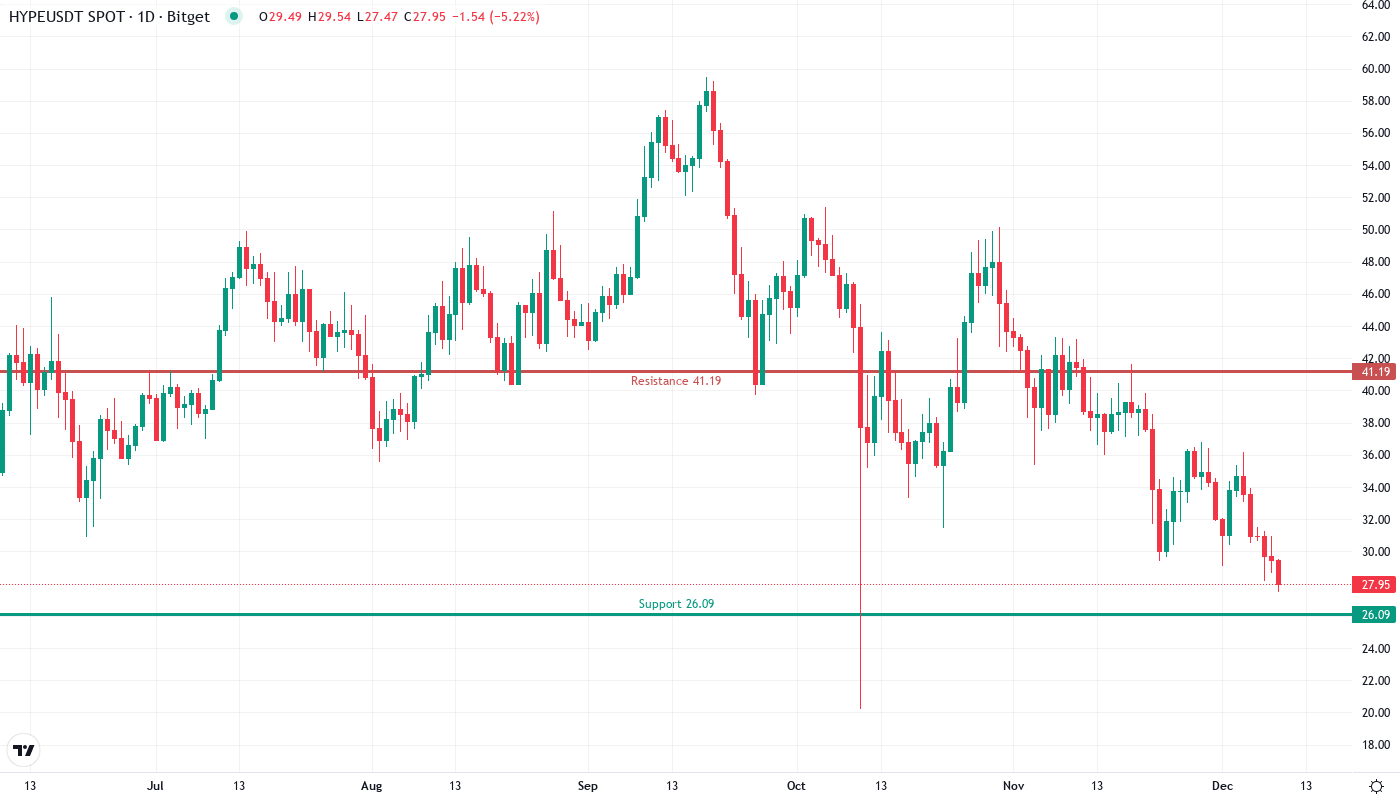
Hyperliquid [HYPE] kick-started a recovery bounce to $27.95 after touching weekly lows near $24.46, representing a devastating 47.5% collapse from December’s euphoric highs of $43.22. The treasury’s announcement of a $30 million buyback program combined with cross-chain USDC integration provided wind to the sails for bulls attempting to defend the psychological $25 level. The main question for traders is: can this relief rally sustain momentum above the reclaimed 20-day EMA, or will sellers emerge at higher levels to continue the broader downtrend?
| Metric | Value |
|---|---|
| Asset | HYPERLIQUID (HYPE) |
| Current Price | $27.95 |
| Weekly Performance | -9.98% |
| Monthly Performance | -30.32% |
| RSI (Relative Strength Index) | 33.0 |
| ADX (Average Directional Index) | 24.5 |
| MACD (MACD Level) | -2.30 |
| CCI (Commodity Channel Index, 20-period) | -157.86 |
Momentum Exhaustion Signals Capitulation Phase Complete
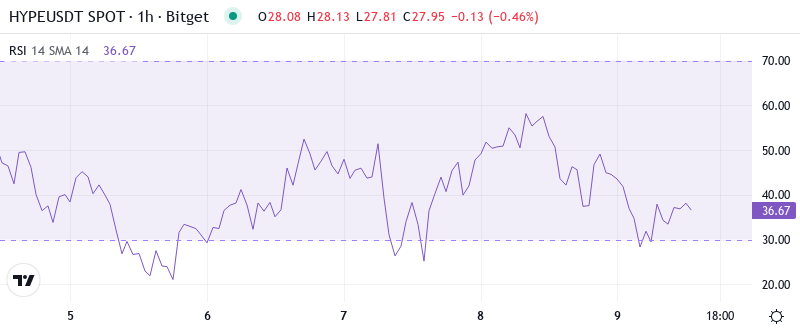
RSI sits at 33.04 on the daily timeframe, marking the first venture into oversold territory since the token’s inception. This reading matches classic capitulation patterns where momentum exhaustion coincides with fundamental catalysts – in this case, the treasury buyback announcement that arrived precisely as price tested critical support. Similar oversold bounces in other high-beta tokens this cycle typically produced 20-30% relief rallies before resuming the primary trend.
For swing traders, this oversold RSI configuration combined with positive news flow creates a tactical long opportunity, though the weekly RSI at 38.91 suggests the longer timeframe remains far from exhausted. The divergence between daily oversold and weekly merely weak warns that any bounce faces significant overhead resistance from trapped longs looking to exit.
ADX at 24.46 Confirms Trend Weakness Opens Door for Volatility
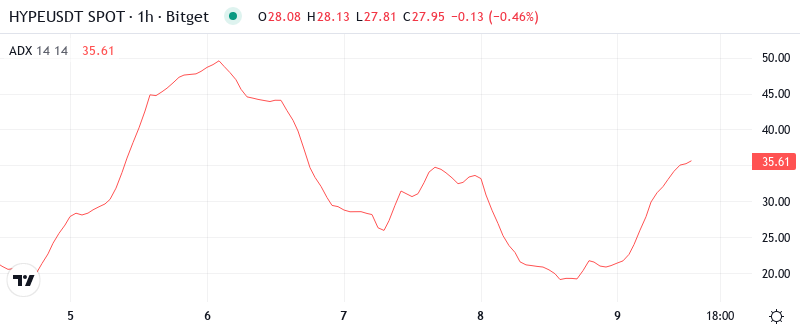
Looking at trend strength, the ADX reading of 24.46 indicates the vicious downtrend has lost its directional conviction. Basically, the shift from ADX readings above 30 during the December collapse to current sub-25 levels signals we’re transitioning from trending to ranging conditions. The combination of weakening trend strength with oversold momentum creates the technical setup for sharp volatility in both directions.
Therefore, day traders should adjust strategies for whipsaw price action rather than smooth directional moves. The buyback program and USDC integration news arrived at the perfect technical moment – when trend exhaustion met oversold conditions. This confluence explains why HYPE managed such a convincing bounce from the $24.46 weekly low.
20-Day EMA at $27.06 Transforms From Resistance to Critical Support
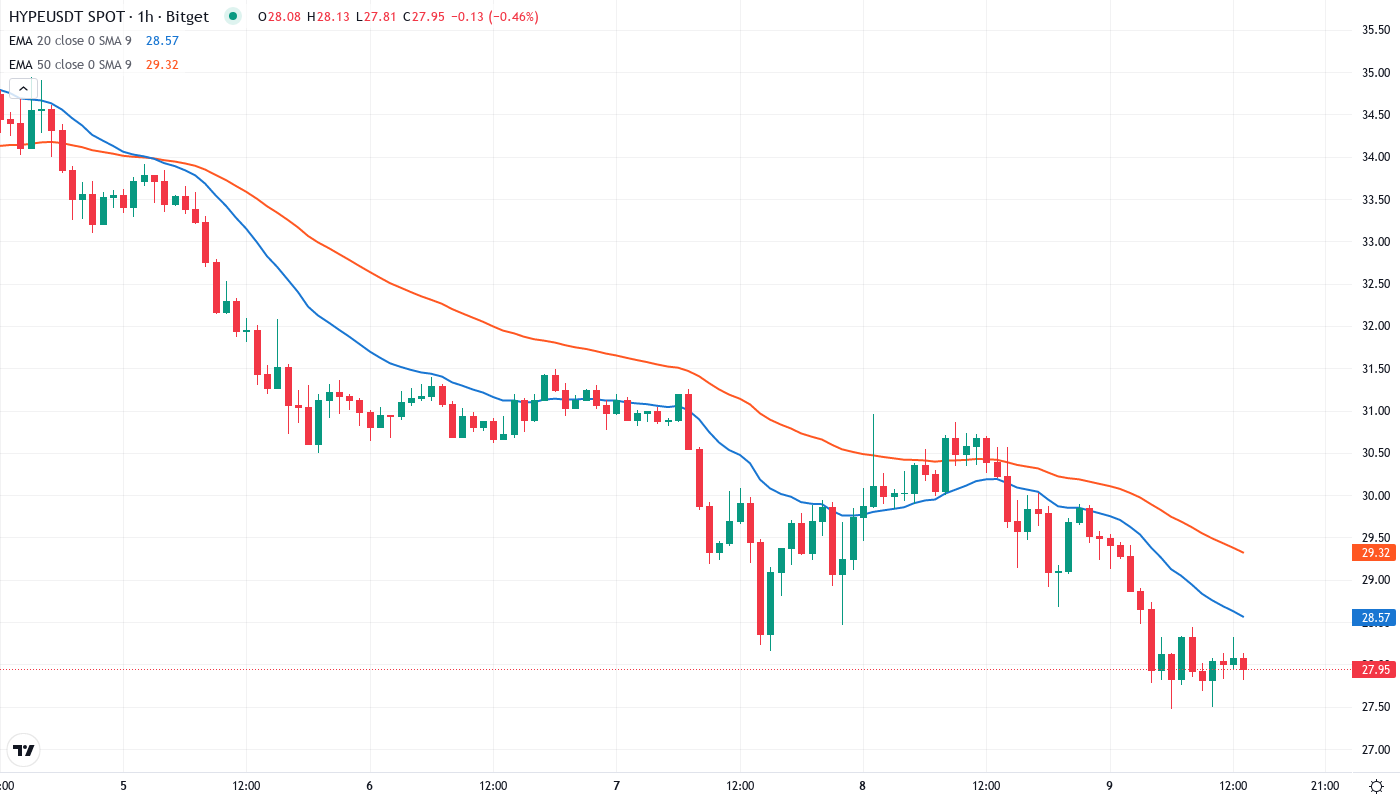
Price action through the EMA ribbons tells a compelling story of market structure repair. HYPE currently trades at $27.95, sitting above the 20-day EMA ($27.06) for the first time since the December breakdown began. More significantly, today’s volume-backed reclaim of this level occurred as the treasury buyback news hit the wires, suggesting institutional support at these levels.
What’s revealing is how the 50-day EMA at $32.30 now looms as the next major resistance overhead, roughly 15% above current prices. The compression between the 10-day ($31.13) and 20-day ($27.06) EMAs signals a volatility expansion incoming – with the leveraged stablecoin trading launch potentially providing the catalyst for the next directional move.
Resistance Stacks Between $31-$39 While Support Builds at $24
Above current price, sellers have fortified multiple resistance zones that bulls must conquer to confirm a genuine trend reversal. The immediate resistance clusters between $31.13 (10-day EMA) and $32.30 (50-day EMA), with the psychological $30 level sitting right in the middle of this zone. December’s support-turned-resistance at $35.29 represents the next major hurdle, followed by the 100-day EMA at $37.68.
Bulls now guard the $24.46 weekly low that coincided with the buyback announcement, creating a clear line in the sand for support. The monthly pivot point at $26.09 provided the initial bounce level and should offer backing on any retest. Below that, the $20 psychological level aligns with the 200-day EMA at $20.19, representing the final defense before uncharted territory.
The market structure reveals a classic relief bounce pattern within a broader downtrend. The confluence of oversold conditions, positive fundamental developments, and reclaim of the 20-day EMA suggests this bounce has legs to test the $30-32 resistance zone. However, the magnitude of the prior decline warns that sellers likely defend the 50-day EMA aggressively.
Bulls Must Convert $30 Resistance While USDC Integration Drives Adoption
Bulls require a decisive daily close above $30 to shift near-term momentum bullish and open the door for a test of the 50-day EMA at $32.30. The cross-chain USDC integration and leveraged trading features provide the fundamental ammunition for such a move, especially if the $30M buyback program deploys capital at these levels.
The bearish scenario triggers if HYPE fails at the $30-31 resistance cluster and breaks back below the 20-day EMA at $27.06 on volume. Such a rejection would likely trap recent buyers and target a retest of $24.46 support, with failure there opening an air pocket to the $20 level where the 200-day EMA waits.
Given the oversold bounce, positive news flow, and trend exhaustion signals, the most probable path sees HYPE consolidating between $27-32 over the coming sessions while the market digests the fundamental improvements. The leveraged stablecoin trading launch could provide the next catalyst for a more decisive move in either direction.