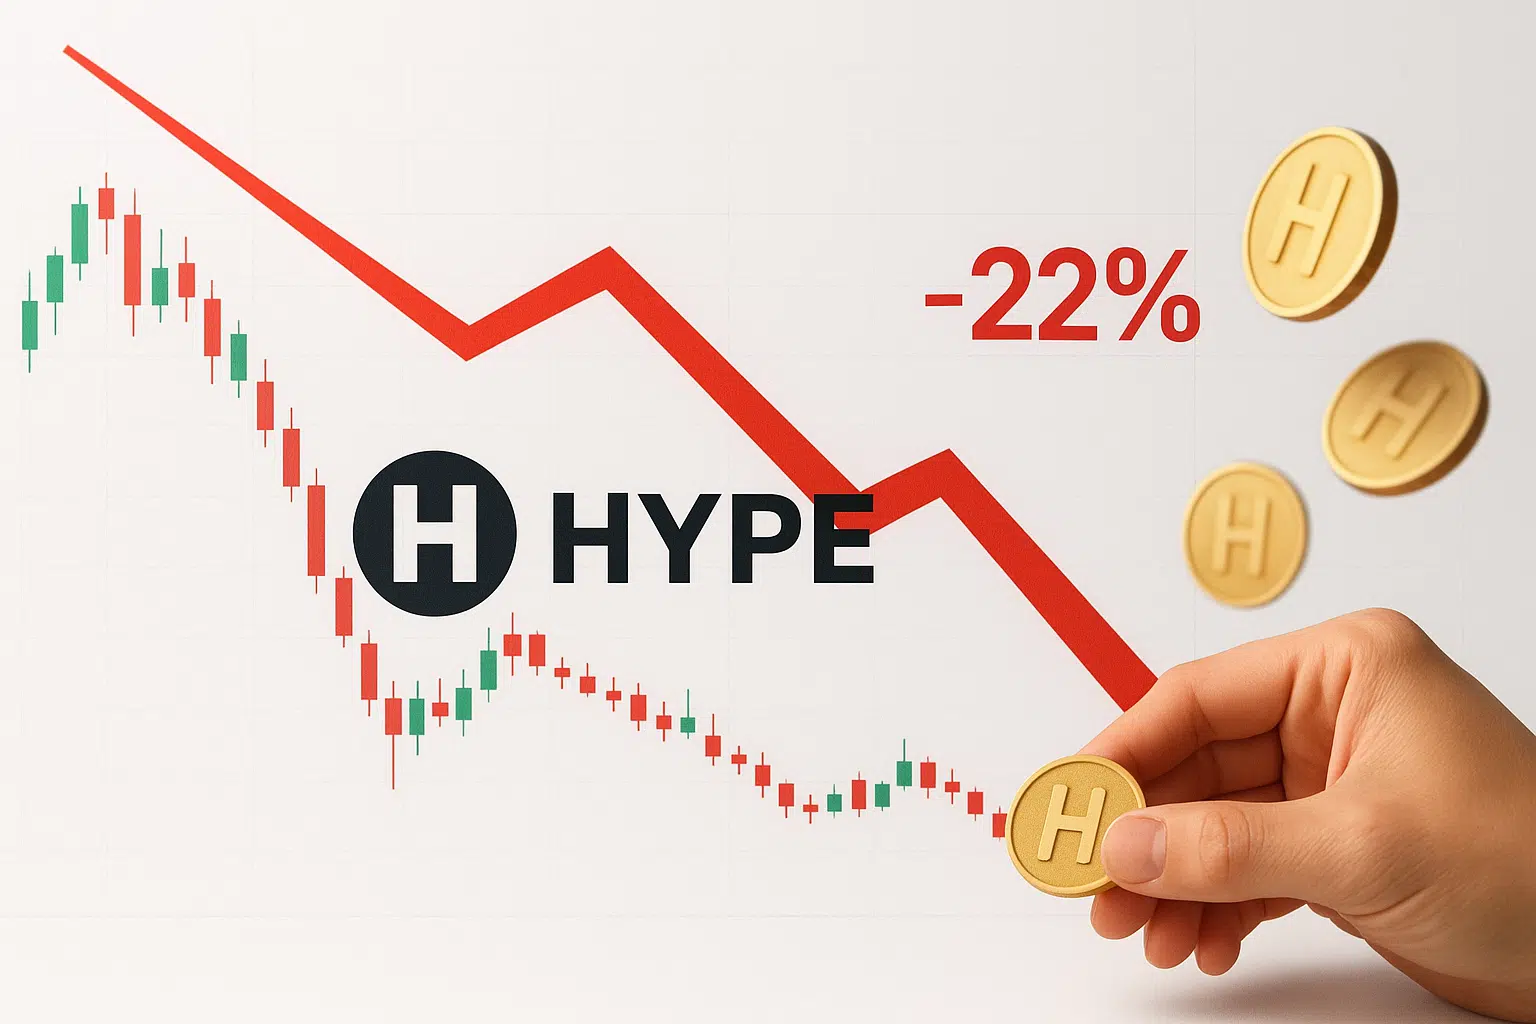
HYPE Tumbles 22% as Momentum Exhaustion Meets Profit-Taking Wave
Market Structure Shifts Lower
- HYPE token’s value plummeted from $50.15 to $31.25.
- This wiped out all gains made in December and resulted in a sudden pullback.
- Nonetheless, institutional interest remains high.
There are established whale holdings, with new partnerships and integrations being forged. Moreover, technical indicators are signaling significant underselling on various levels, which indicates a final point of despair and the start of a bullish reversal.
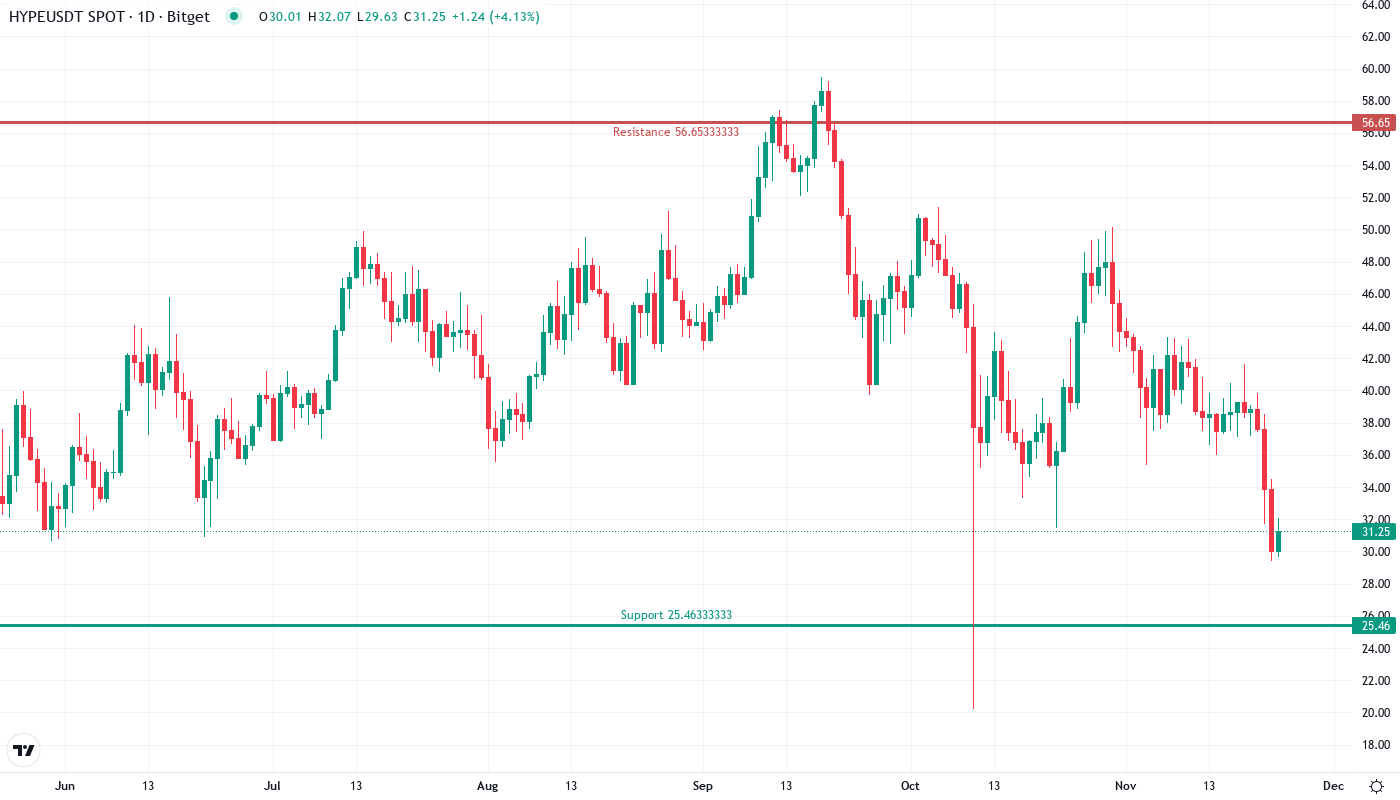
The smaller of the two 2-day VWAP support levels at $29.36 was also crushed yesterday, reinforcing the larger August VWAP zone as the most immediate target if these selloff conditions fail to stabilize. Should HYPE be able to rebound from $31.25 support and recapture the VWAP at $33.36, traders can likely expect the token to retest the two shorter-term VWAPs that gave way to yesterday’s collapse. That upward trajectory is supported by the white demand/seagreen resistance buy zone, currently valued at $35.74, where liquidation levels have been confirmed.
| Metric | Value |
|---|---|
| Asset | HYPERLIQUID (HYPE) |
| Current Price | $31.25 |
| Weekly Performance | -18.98% |
| Monthly Performance | -22.24% |
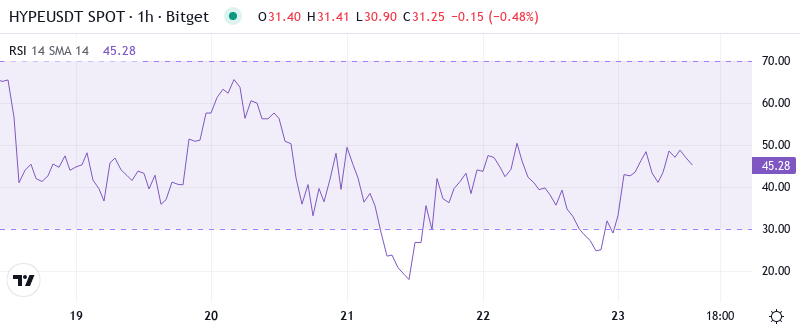
| RSI (Relative Strength Index) | 32.7 |
| ADX (Average Directional Index) | 24.7 |
| MACD (MACD Level) | -2.26 |
| CCI (Commodity Channel Index, 20-period) | -257.41 |
RSI Drops to 32.73 – First Oversold Territory Since Launch Rally
With a powerful resistance barrier at the recent all-time high price, the $22 level will likely suppress further rally attempts in the coming weeks so that range-bound trading could persist while this extremely low float attracts additional speculative players. A complete retracement back into parabolic support would bring HYPE down to $11 before the asset once again becomes compelling for those positioning their portfolios defensively, but until those levels have been reached the more risk-averse may find it prudent to avoid getting incestuous with the newest meme token on the block.
Historically, in a number of cases with numerous cryptocurrencies, 15-25% relief rallies happened after significant drops at the oversold RSI mark on the 4-day or daily which we recently hit. For instance, during the 2018 bear market this occurred frequently. The weekly would bounce out of oversold keeping the bear trend intact and providing a lower high for an optimal short entry point.
ADX at 24.69 Signals Trend Exhaustion After Parabolic Move
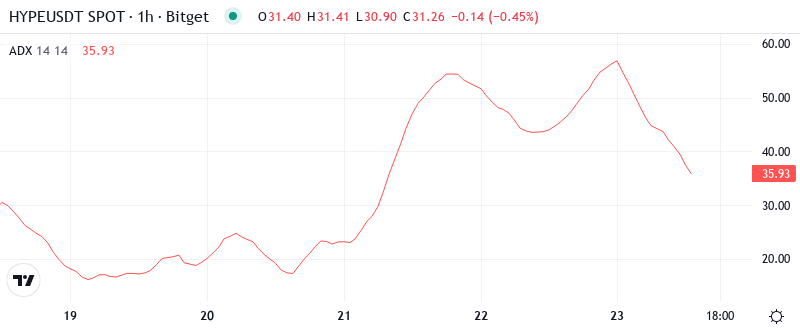
It is evident that the momentum has waned with ADX now falling to 24.69 after being in excess of 40 as HYPE went parabolic. Transitioning from extreme trending to almost ranging highlights that the one-way buying panic is over and the price is left to find a new equilibrium. The fast deceleration in trend strength is in line with what is usually witnessed after blow-off tops in tokens that have just hit the market.
In simpler terms, the ADX is showing that we are moving from a very strong trend phase to a more sideways phase where bulls and bears are going to be fighting it out. As such, day traders want to transition from making trades that go in the direction of the current trend to trading setups that follow the ebb and flow of the price range in the absence of a clear trend. This means looking to trade off well-established support and resistance levels, rather than momentum happening to continue in the same direction. The announcement that Anchorage Digital is offering HYPE staking support via Figment here could have the necessary underlying demand driver to renew the trend phase once the consolidation has run its course.
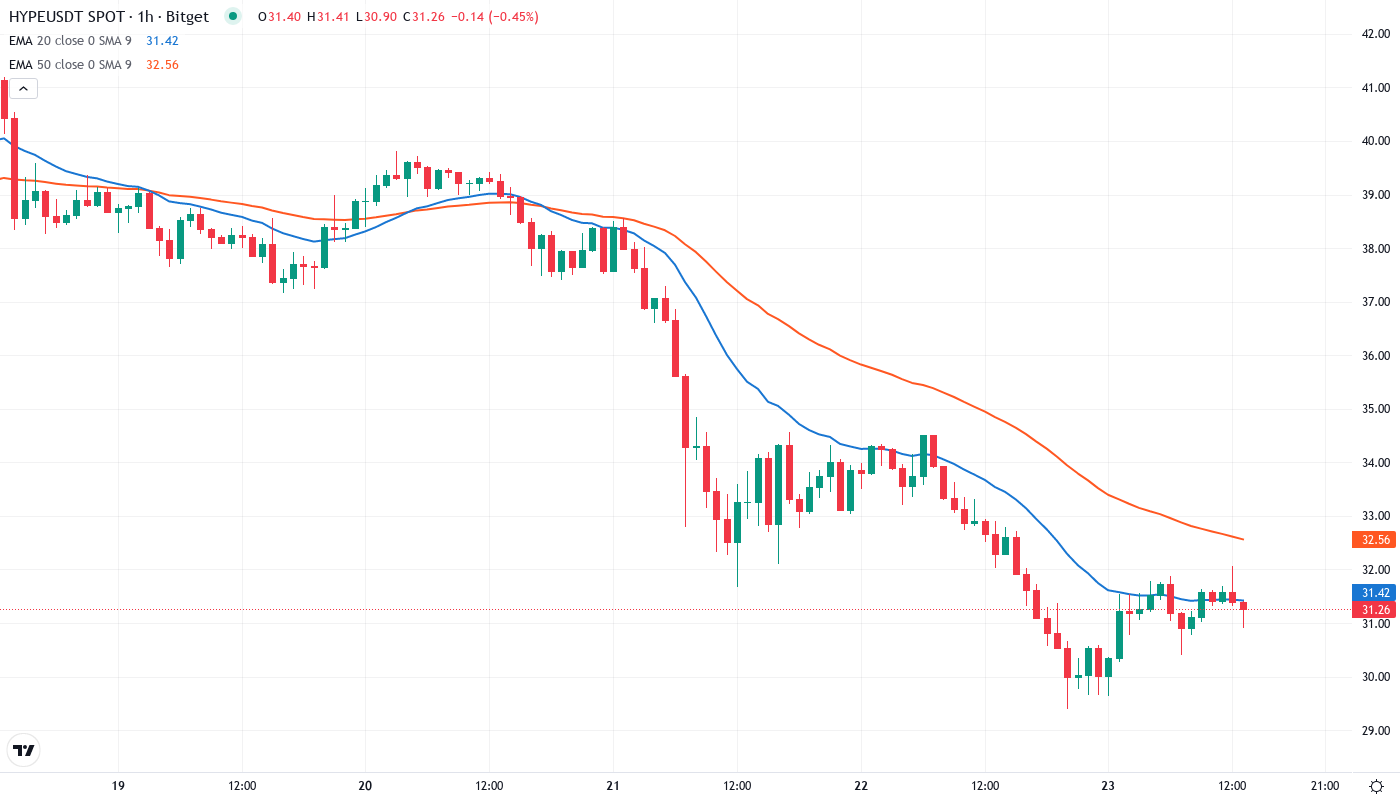
20-Day EMA at $38.33 Becomes First Major Resistance After Support Break
The current market is a dirty one for sure. Whispers of gamma rolling across today’s spits and spots does little to confirm traction in either direction for the “stock that matters”. Earnings numbers come in the window of mid-March causing increased volatility upon variable price discovery processes related to HYPE. Buyers step down rapidly. Sellers maintain patience. Measurements according to the oscillator showing a -67.24 value. Far exceeding the yellow critical 100 RSI. Potency for green remains apparent.
What is most telling is that the price has refused to cross above the 20-day EMA on two occasions during the decline, which highlights that the sellers dominate the short-term price activity. The 50-week EMA, which is located at $39.77, will also act as a resistance confluence in the $38 to $40 zone, making it very difficult for the relief rally to overcome that barrier. The previous support zone of $38 will now act as a stiff resistance that the bears will try to defend strongly if the price rebounds.
Whale Long Position at $50 Zone Creates Heavy Resistance Overhead
There are multiple resistance levels above the current price ranging from $38 to $50. The whale’s $2M leveraged long entry likely created some psychological resistance around the monthly high. The first cluster ranges from $38.33 (20-day EMA) to $40.34 (monthly pivot). The $44.73 level marks the 50-day EMA, which is the next obstacle bulls will face. If bulls manage to push through the $50 psychological resistance, the weekly 200 EMA will likely put a stop to that at $54.64.
Bulls are looking to defend multiple support levels between the current price and the psychological $25 level. The monthly S1 pivot at $25.46 is below the current price. The $31.25 area is also offering initial support, along with the round-number vicinity and the 38% Fibonacci retracement of the rally for the year. Volume profile analysis indicates that the greatest trading activity occurred between $25-35 during the initial accumulation phase. Therefore, this area may draw if selling pressure continues.
This setup is similar to a blow-off top followed by mean reversion, where price has to consolidate and re-establish a base before making another move to the upside. In terms of the overall market structure, this suggests that HYPE has shifted from a straight momentum, one-way trade, to the type of environment that allows for two-way trading with likelihood in both directions. The fundamental overlay is still positive as altcoin futures trading is being added to Coinbase and the new integration provided by SafePal offers more fundamental reasons to be excited despite the apparent technical damage caused by this week’s pullback.
Recovery Requires Reclaim of $38 Resistance Cluster on Volume
To shift this short-term trend for AST/USDT and recover these levels, buyers must step in and defend the $34 to $35 support zone. Coindesk mentioned this area cumulated strong interest in late October as selling seems to have been largely exhausted. Part of this short-term pattern is also the Level 2 environment, with numerous entries and exits at the key level of $34.69 cent.
If the 1D Super Guppy is broken, the 1D Ichimoku on the long-term uptrend zone around $25 would be the last stand before moving into the previous range and nullifying the breakout. The 1W Ichimoku is still incredibly bullish and the 3D Kijun has been solid support, so it’s likely the Super Guppy hanging as the primary consolidation level.
Considering the expected pullback over the coming weeks, our ideal entry point with the option is between $23-27 in hopes of an earlier than anticipated selloff into the yearly lows. Given the likely cooldown and recent stress exposed in the crypto supported by the underperformance of smaller coins, we believe it will be very difficult for HYPE to maintain these lofty valuations until there is more normalization in the space to spur the next round of adoption.