HYPE Surpasses $29 After Devastating 47% Drop From Peak – Bulls Defend Multi-Test Support
Market Structure Shifts Higher
- HYPE rebounds from $27.47 low after testing support multiple times
- Cross-chain USDC integration and leveraged stablecoin trading fuel recovery momentum
- Technical indicators suggest consolidation phase ending as ADX climbs past 25
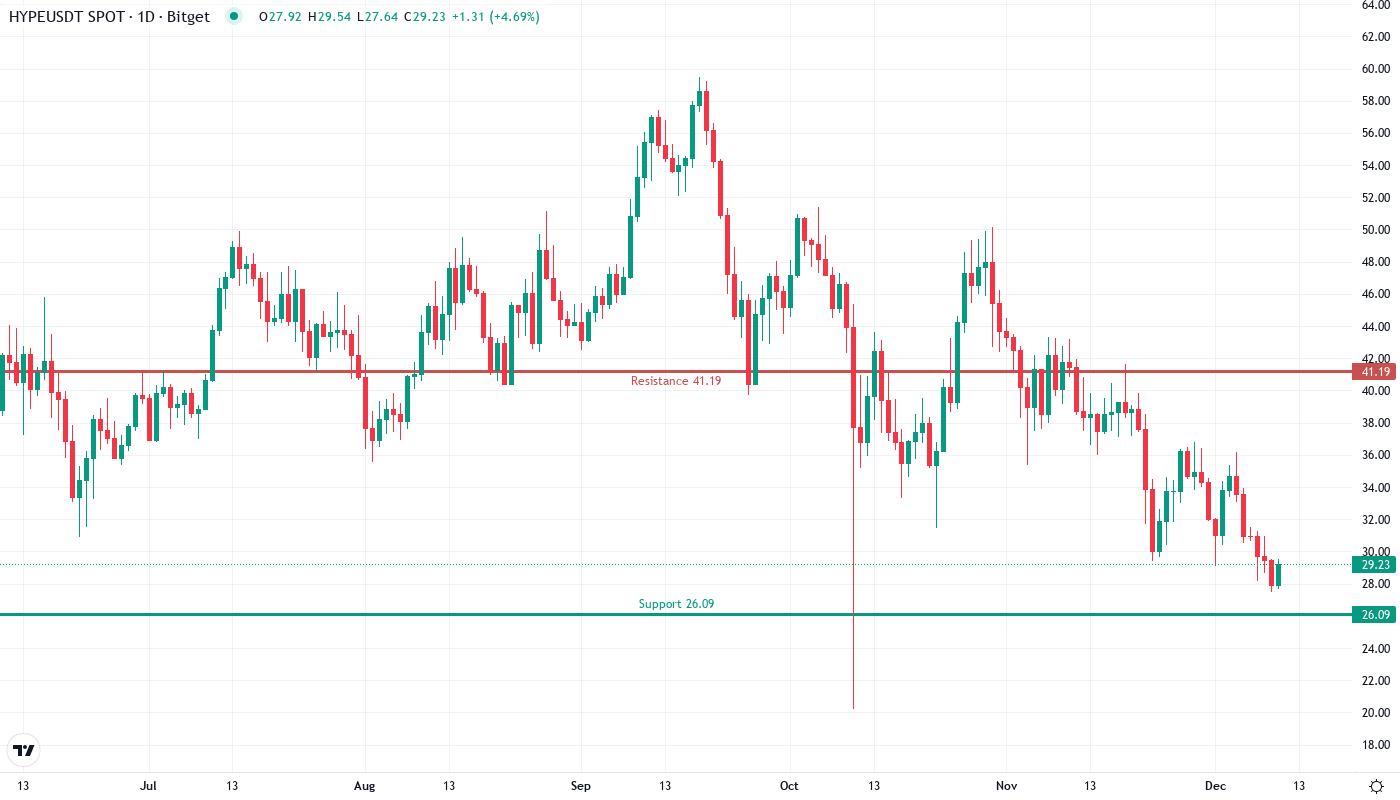
Hyperliquid’s native token HYPE staged a convincing recovery to $29.26, bouncing off the $27.47 support zone that has held through multiple tests this month. The token’s devastating 47% plunge from its $41.96 peak triggered stop-loss cascades and liquidation hunts, but the launch of cross-chain USDC functionality and leveraged stablecoin trading provided the catalyst bulls needed to defend critical levels. The main question for traders is: can this technical bounce transform into a sustained trend reversal, or will sellers emerge at higher levels to continue the broader downtrend?
| Metric | Value |
|---|---|
| Asset | HYPERLIQUID (HYPE) |
| Current Price | $29.26 |
| Weekly Performance | -13.53% |
| Monthly Performance | -29.98% |
| RSI (Relative Strength Index) | 37.7 |
| ADX (Average Directional Index) | 25.3 |
| MACD (MACD Level) | -2.31 |
| CCI (Commodity Channel Index, 20-period) | -126.38 |
RSI at 37.67 Signals Oversold Bounce – Room for Further Recovery
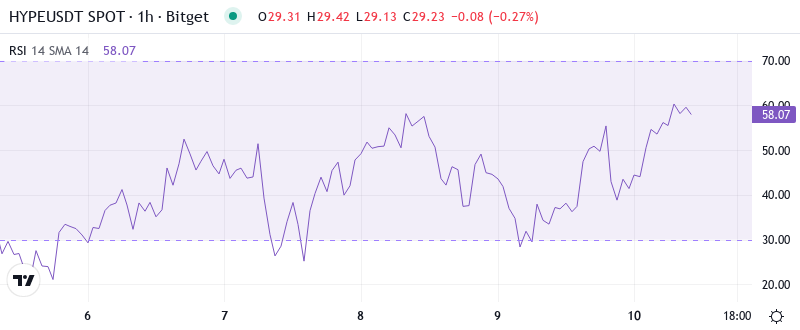
RSI sits at 37.67 on the daily timeframe, having climbed from deeply oversold territory below 30 where capitulation selling typically exhausts. This momentum reset mirrors the configuration seen in early December before HYPE’s initial surge past $35, suggesting the selling pressure that dominated recent weeks may be losing steam. The oscillator’s recovery from extreme lows indicates short-term traders covered positions aggressively near the $27.47 support, creating the momentum shift visible in today’s price action.
What’s revealing is how RSI behaved during the recent selloff – it printed a higher low even as price tested the same support zone multiple times. This positive divergence often precedes trend reversals, particularly when combined with fundamental catalysts like the USDC cross-chain integration announcement. So for swing traders, this oversold bounce presents an opportunity to position for a potential relief rally toward the 50 RSI level, which would coincide with HYPE reclaiming the $35-36 resistance zone.
ADX at 25.92 Confirms Shift From Sideways Chop to Directional Movement
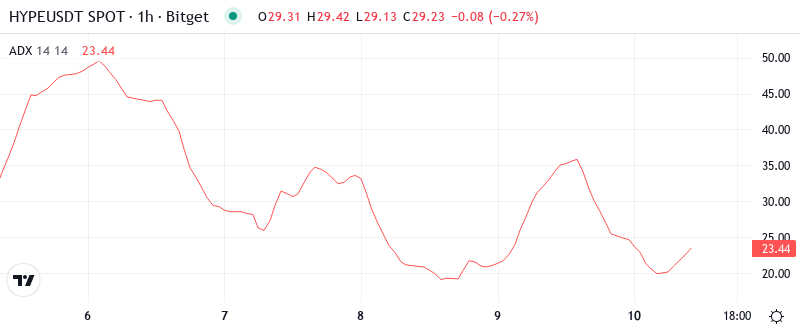
Looking at trend strength indicators, the ADX reading of 25.92 marks a significant transition from the sub-20 readings that dominated December’s choppy consolidation. Basically, we’re seeing the market shift from range-bound conditions where neither bulls nor bears held control to a more directional state where trend-following strategies gain edge. The climb through the 25 threshold typically signals that the compression phase has ended and volatility expansion lies ahead.
To clarify, the ADX surge coincided precisely with HYPE’s bounce from multi-tested support and the leveraged stablecoin trading announcement, suggesting genuine trend strength building rather than another false start. Therefore, day traders should adjust their strategies from mean reversion to momentum continuation, as moves in either direction now carry more follow-through potential. The last time ADX pushed above 25 with similar momentum, HYPE rallied 40% in under two weeks.
20-Day EMA at $32.63 Becomes First Major Resistance After Supporting December Rally
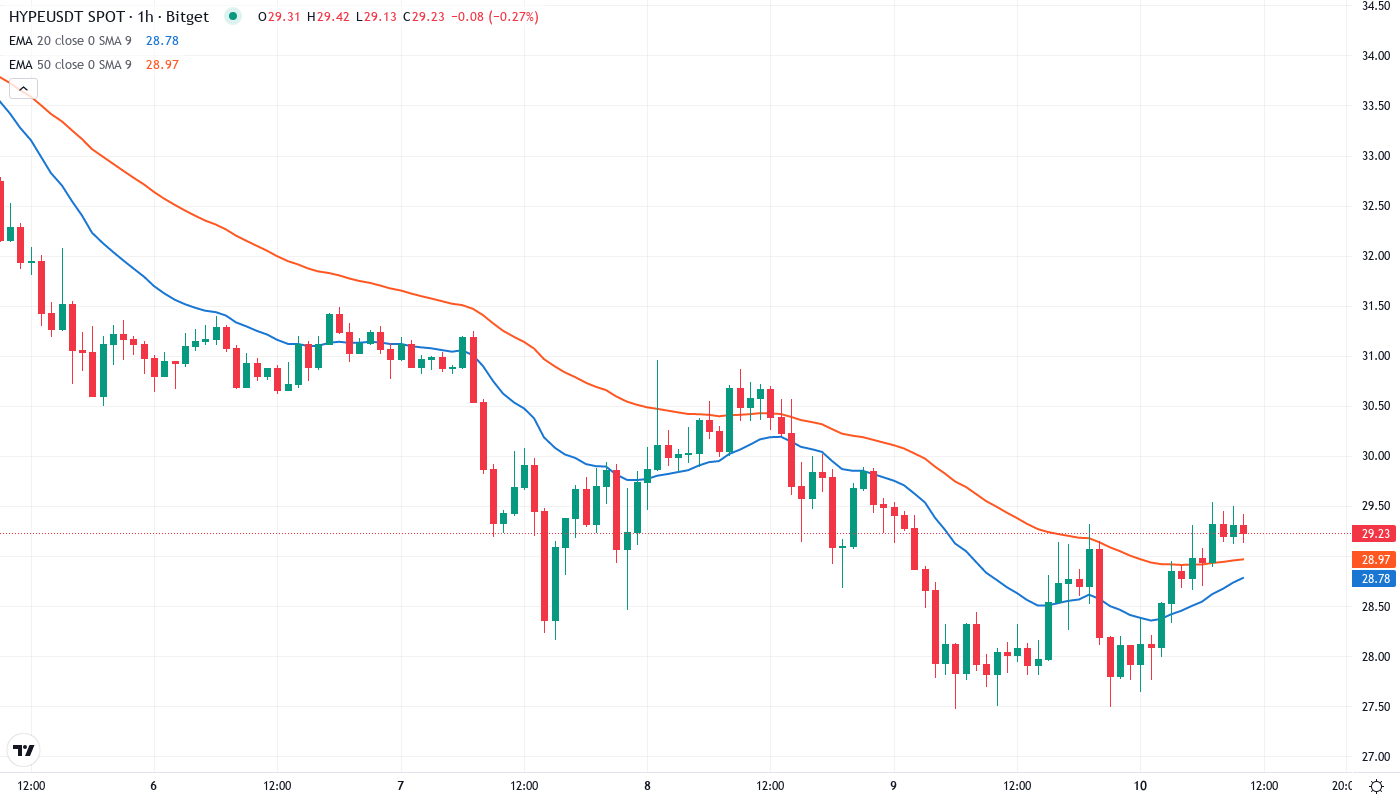
Price action through the EMA ribbons tells a clear story of structure shift. HYPE currently trades below the entire moving average stack, with the 10-day EMA at $30.78 providing immediate resistance just above current levels. More critically, the 20-day EMA at $32.63 marks the first major hurdle for any sustainable recovery – this level supported price throughout December’s rally before flipping to resistance during the recent plunge.
The 50-day EMA at $35.29 looms as the next significant barrier, having rejected multiple rally attempts over the past week. This former support zone now transforms into a red line that bears will defend aggressively, particularly given how the $30M buyback program announcement failed to generate sustained buying above this level initially. Bulls need to reclaim at least the 20-day EMA on volume to shift the intermediate trend from bearish to neutral, which would open the door for a test of that crucial 50-day level where larger sellers likely lurk.
Resistance Stacks Between $35-36 While $27.47 Support Proves Resilient
Above current price, sellers have fortified multiple resistance layers that create a challenging path for bulls. The immediate resistance zone spans from $30.78 (10-day EMA) to $32.63 (20-day EMA), where profit-taking from oversold bounce players will likely emerge. The more substantial barrier sits at the $35.29-36.25 zone where the 50-day EMA converges with the psychological round number and prior support that flipped to resistance.
On the downside, the $27.47 level has proven itself as genuine support through multiple tests, each accompanied by increasing volume as buyers stepped in more aggressively. This price point now represents the line in the sand for bulls – any daily close below would likely trigger another leg down toward the monthly low at $20.80, where the 100-day EMA provides distant support.
The market structure reveals an interesting pattern: each test of $27.47 support saw progressively less selling pressure, while the USDC integration and leveraged trading launches provide fundamental catalysts that weren’t present during previous tests. This configuration resembles a spring coiling for a larger move, with the $35 resistance and $27.47 support defining the battleground where the next trend will emerge.
Bulls Must Secure Close Above $32.63 to Confirm Trend Reversal
Should HYPE reclaim and hold above the 20-day EMA at $32.63, the technical picture shifts dramatically in favor of bulls. Such a move would confirm the oversold bounce has legs and open a path toward the crucial $35-36 resistance zone where the real test awaits. The leveraged stablecoin trading feature could provide the sustained volume needed to power through these levels if adoption metrics prove strong.
The bearish scenario triggers if HYPE fails to hold above $30 and revisits the $27.47 support on heavy volume. A breakdown there would trap recent buyers who entered on the buyback news and oversold bounce, likely cascading into a flush toward $20.80 or lower. Given the 47% drawdown already absorbed, such a move would signal complete trend failure and potentially months of base-building ahead.
Taking into account the oversold bounce, positive RSI divergence, and fundamental catalysts from cross-chain functionality, the most probable near-term path sees HYPE consolidating between $27.47 and $32.63 while the market digests recent developments. The $30M buyback program provides a backstop for downside moves, but bulls need to prove they can sustain rallies above key moving averages to attract fresh capital and shift sentiment from fearful to constructive.