HYPE Surpasses $28 After 31% Monthly Drop as Bulls Guard Critical Support

Market Pulse
- HYPE trades at $28.81, down 31% over the past month but holding above key support at $27.47
- Treasury’s $30M buyback program and USDC cross-chain integration provide fundamental catalysts for recovery
- Bulls now guarding higher lows after reclaiming the 50-day EMA at $26.09
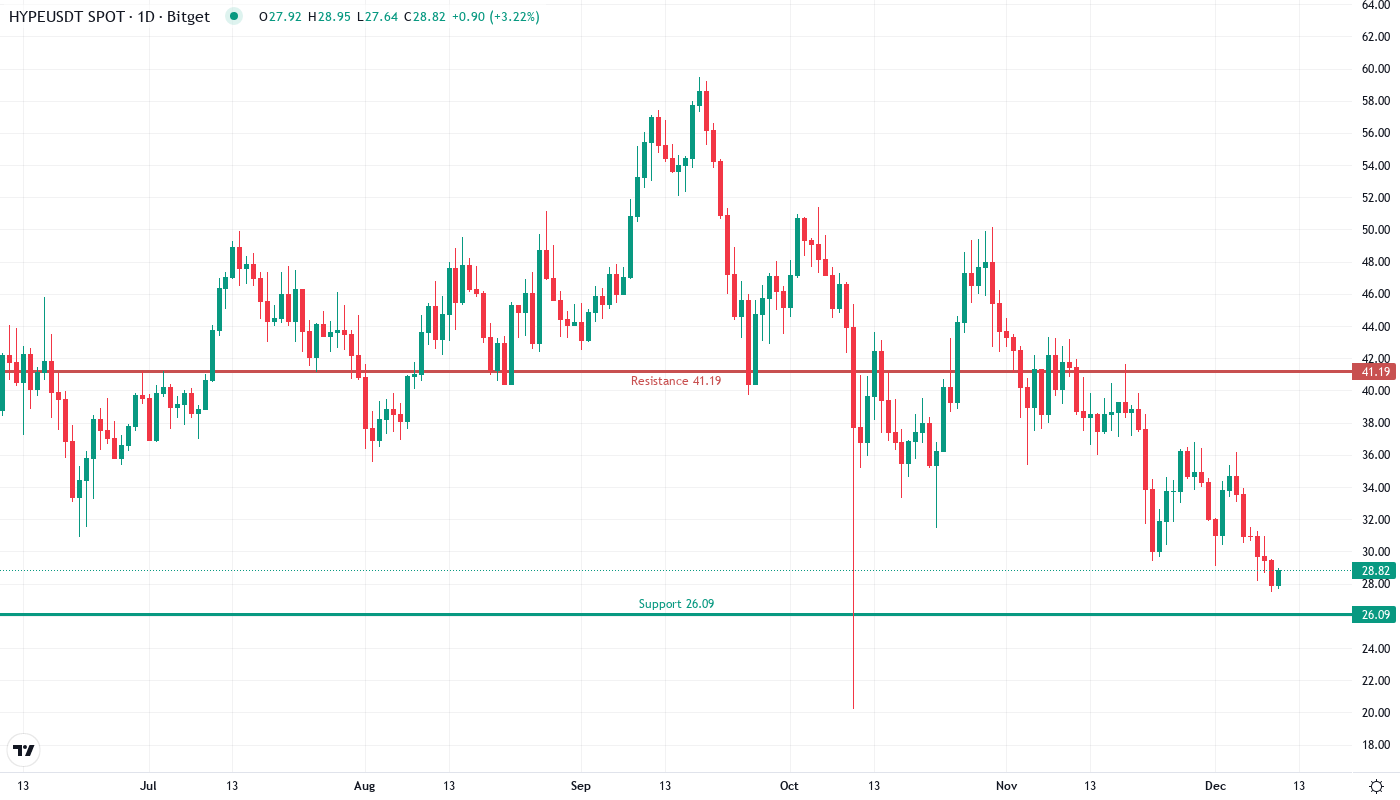
Hyperliquid’s HYPE token has endured a devastating drop from its monthly high of $41.96 to current levels at $28.81, shedding roughly $13 in value over four weeks. The 31% monthly decline accelerated after the initial euphoria around the token’s meteoric 1,052% yearly performance began cooling off, though recent developments including a $30M treasury buyback program and expanded USDC cross-chain functionality have helped bulls establish a defensive line above $27.47. The main question for traders is: can this combination of technical support and fundamental catalysts kick-start a genuine recovery, or will sellers continue pressing their advantage?
| Metric | Value |
|---|---|
| Asset | HYPERLIQUID (HYPE) |
| Current Price | $28.81 |
| Weekly Performance | -14.86% |
| Monthly Performance | -31.06% |
| RSI (Relative Strength Index) | 36.2 |
| ADX (Average Directional Index) | 25.3 |
| MACD (MACD Level) | -2.35 |
| CCI (Commodity Channel Index, 20-period) | -136.49 |
Momentum Stalls at 36.18 – Neither Overbought Nor Oversold
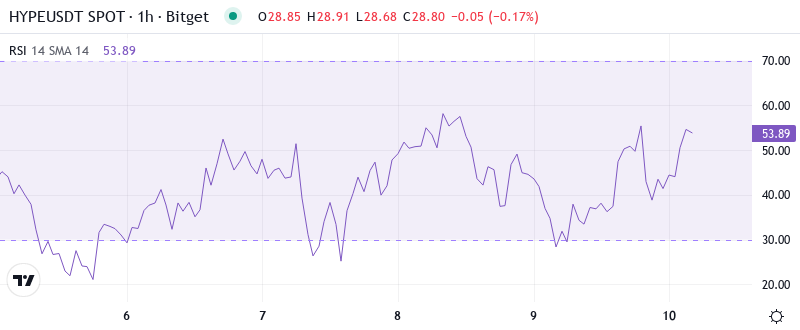
RSI sits at 36.18 on the daily timeframe, placing momentum squarely in no-man’s land between oversold territory and the neutral 50 mark. This reading suggests the immediate selling pressure has eased without yet flipping to bullish conviction – essentially a pause in the downtrend rather than a reversal signal. Similar RSI configurations in growth tokens often precede consolidation phases where price builds energy for the next directional move.
What’s revealing is how RSI behaved during the $30M buyback announcement – it barely budged from the mid-30s despite the positive news, indicating sellers still dominate market psychology. So for swing traders, this balanced-yet-bearish RSI means waiting for a clear break above 40 before positioning aggressively long, as the oscillator needs to prove buyers have truly returned rather than just bottom-fishing temporarily.
ADX at 25.3 Signals Trend Exhaustion After Month-Long Slide
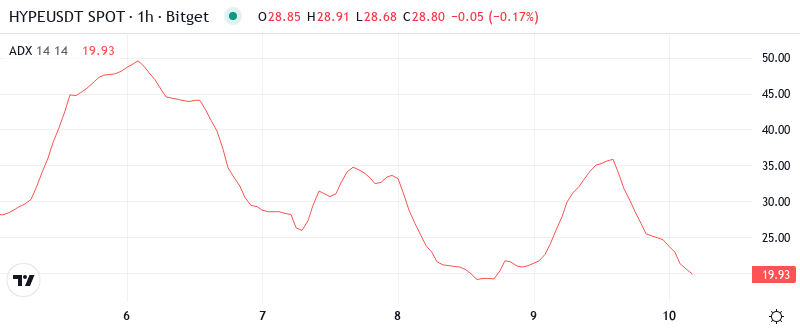
Looking at trend strength, the ADX reads 25.3, hovering right at the threshold between trending and choppy conditions. After climbing above 30 during HYPE’s sharp December decline, this pullback in ADX suggests the bearish trend is losing steam – basically, sellers are running out of conviction at these levels. The combination of ADX dropping from stronger readings while price stabilizes often marks inflection points where markets transition from trending to ranging behavior.
To clarify, the ADX is indicating that we are switching from a directional downtrend to more two-way price action. Therefore, day traders should adjust their strategies from trend-following to range-trading setups, particularly as the new leveraged stablecoin trading features and USDC cross-chain integration attract fresh liquidity flows that could create volatility without clear direction until buyers or sellers definitively take control above $30 or below $27.
50-Day EMA at $26.09 Transforms From Resistance to Critical Support
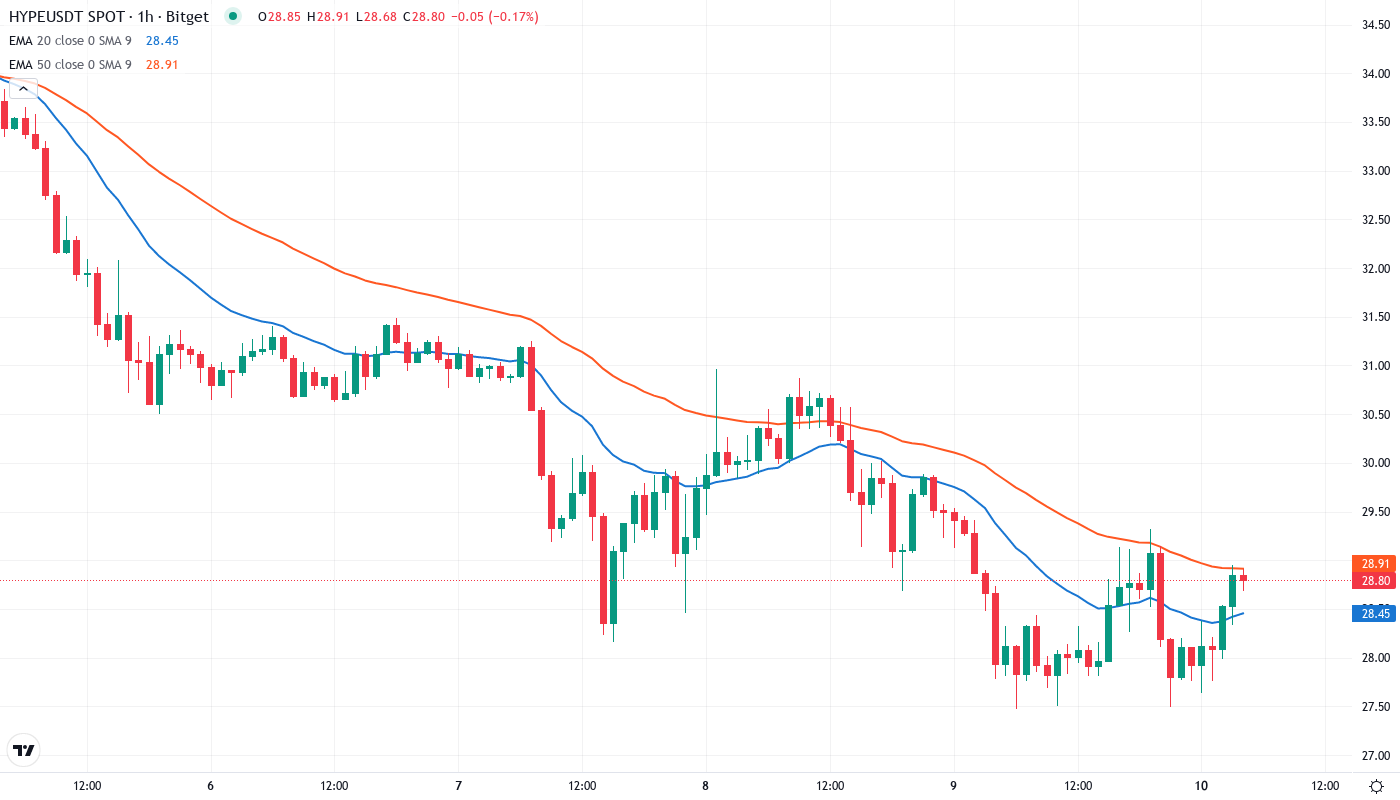
Price action through the EMA ribbons tells an encouraging story for bulls. HYPE currently trades above the 10-day ($32.66), 20-day ($27.76), and crucially, the 50-day EMA at $26.09, which served as resistance during the December selloff before this week’s reclaim. The 100-day and 200-day EMAs sit much higher at $41.19 and $65.49 respectively, painting a picture of how far price has fallen from the longer-term trend – yet the fact that buyers emerged to defend the 50-day suggests this level now represents a line in the sand.
More telling is the compression between the 20-day and 50-day EMAs, with only $1.67 separating them. This tight configuration, combined with the treasury buyback reducing circulating supply, creates a coiled spring setup where any sustained move above the 20-day at $27.76 could quickly target the gap up to the 100-day EMA. It is worth mentioning that the HyperEVM and HyperCore USDC integration news coincided perfectly with the 50-day EMA bounce, reinforcing this level’s technical importance.
Support at $27.47 Tested Multiple Times While Resistance Stacks at $32-$35
The immediate resistance clusters between $32.34 (weekly close) and $35.29 (100-day EMA), where December’s relief rallies consistently failed. Above that, the psychological $40 level aligns with the monthly high at $41.96, creating a formidable barrier that would require significant buying pressure to overcome – likely needing sustained positive developments from the expanded trading features to attract that level of demand.
Bulls defend multiple support layers below current price, with the most critical being the monthly low at $27.47 that has now been tested three times without breaking. Secondary support rests at the 50-day EMA ($26.09), while the monthly S1 pivot at $20.81 provides a distant safety net should current levels fail – though losing the $27 handle would likely trigger stop-loss cascades given how many traders are watching this level.
This configuration resembles a classical accumulation pattern where smart money quietly positions during peak pessimism. The $30M buyback program essentially puts a bid under the market while the new 3x leveraged stablecoin trading and seamless USDC transfers between HyperCore and HyperEVM create fresh use cases that could attract liquidity once sentiment shifts.
Recovery Requires Convincing Close Above $32 as Bears Target $27 Break
Bulls require a decisive close above $32.34 to confirm the recovery scenario, which would clear the weekly resistance and open the path toward the 100-day EMA at $35.29. The combination of treasury buybacks reducing supply and growing adoption of the leveraged trading features provides the fundamental fuel for such a move, particularly if broader crypto markets cooperate.
The bearish scenario triggers if sellers drive a daily close below $27.47, breaking the triple-tested support on volume. This would trap recent bottom-buyers and likely flush positions down to the 50-day EMA at $26.09 initially, with potential to cascade toward the $20.81 monthly pivot if that level fails to hold – essentially unwinding all the stabilization work of the past week.
Given the technical setup showing trend exhaustion via ADX, support holding at key levels, and fundamental catalysts from the buyback program and platform upgrades, the most probable near-term path is for HYPE to establish a trading range between $27.47 and $32.34 while the market digests these developments before attempting the next directional move.