HYPE Plunges 29% as $30M Buyback Fails to Stem December Selloff
Market Structure Shifts Lower
- HYPE crashes from $41.96 to $29.49 in just one week despite major protocol upgrades
- $30 million treasury buyback program announced but price continues sliding through support
- Cross-chain USDC integration and leveraged stablecoin trading launch amid bearish momentum
Hyperliquid’s native token HYPE suffered a devastating 29.4% weekly plunge, tumbling from December’s high of $41.96 to current levels at $29.49 as the $30 million buyback program failed to arrest the selloff. The token shed nearly $12.50 in value over seven days, erasing a month’s worth of gains despite the protocol launching cross-chain USDC integration and new leveraged stablecoin trading features. The main question for traders is: can the psychological $30 level hold, or will technical weakness overwhelm the fundamental improvements?
| Metric | Value |
|---|---|
| Asset | HYPERLIQUID (HYPE) |
| Current Price | $29.49 |
| Weekly Performance | -12.85% |
| Monthly Performance | -29.43% |
| RSI (Relative Strength Index) | 38.4 |
| ADX (Average Directional Index) | 25.3 |
| MACD (MACD Level) | -2.29 |
| CCI (Commodity Channel Index, 20-period) | -124.50 |
Momentum Exhaustion Signals Capitulation Phase Complete
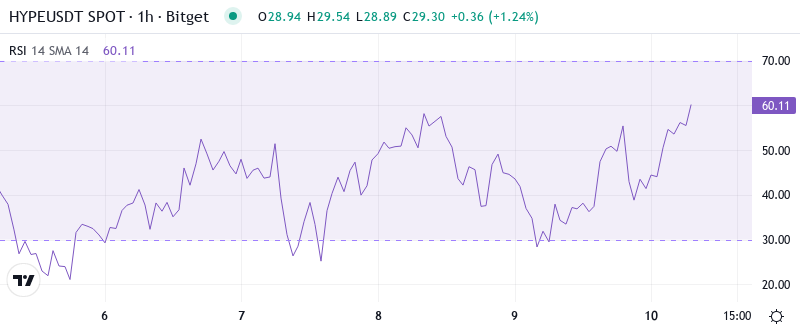
RSI sits at 38.42 on the daily timeframe, marking the first oversold reading since the token’s initial listing volatility. This sharp momentum reset from neutral territory just a week ago suggests panic selling has run its course – at least temporarily. The oscillator’s rapid descent mirrors the price action’s violence, dropping over 10 points in tandem with HYPE’s 29% weekly crash.
Similar oversold bounces in other DeFi tokens typically produce relief rallies of 15-20% before sellers reassert control. So for swing traders, this oversold RSI combined with the $30 million buyback announcement creates a potential bounce setup, though any recovery faces heavy overhead resistance from trapped buyers. The cross-chain USDC integration news couldn’t prevent the momentum collapse, indicating technical factors currently outweigh fundamental catalysts.
ADX at 25.3 Confirms Shift From Sideways to Trending Lower
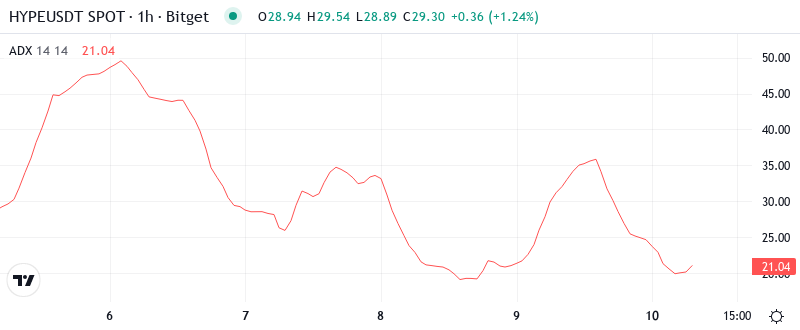
At the level of 25.3, the ADX entry indicates that HYPE has transitioned from choppy consolidation into a defined downtrend. The indicator climbed from the low teens just as price broke below the $35 support zone, confirming seller conviction behind this move. Basically, the market structure has shifted from range-bound conditions where mean reversion worked to trending conditions favoring momentum strategies.
This ADX reading above 25 warns that the selloff likely has further to run before exhausting. To clarify, day traders should adapt their approaches from buying dips in a range to selling rallies in a downtrend until ADX drops back below 20. The leveraged stablecoin trading launch ironically coincided with this trend strength increase, as traders potentially used the new feature to short HYPE itself during the cascade.
20-Day EMA at $36.27 Now Caps Rally Attempts
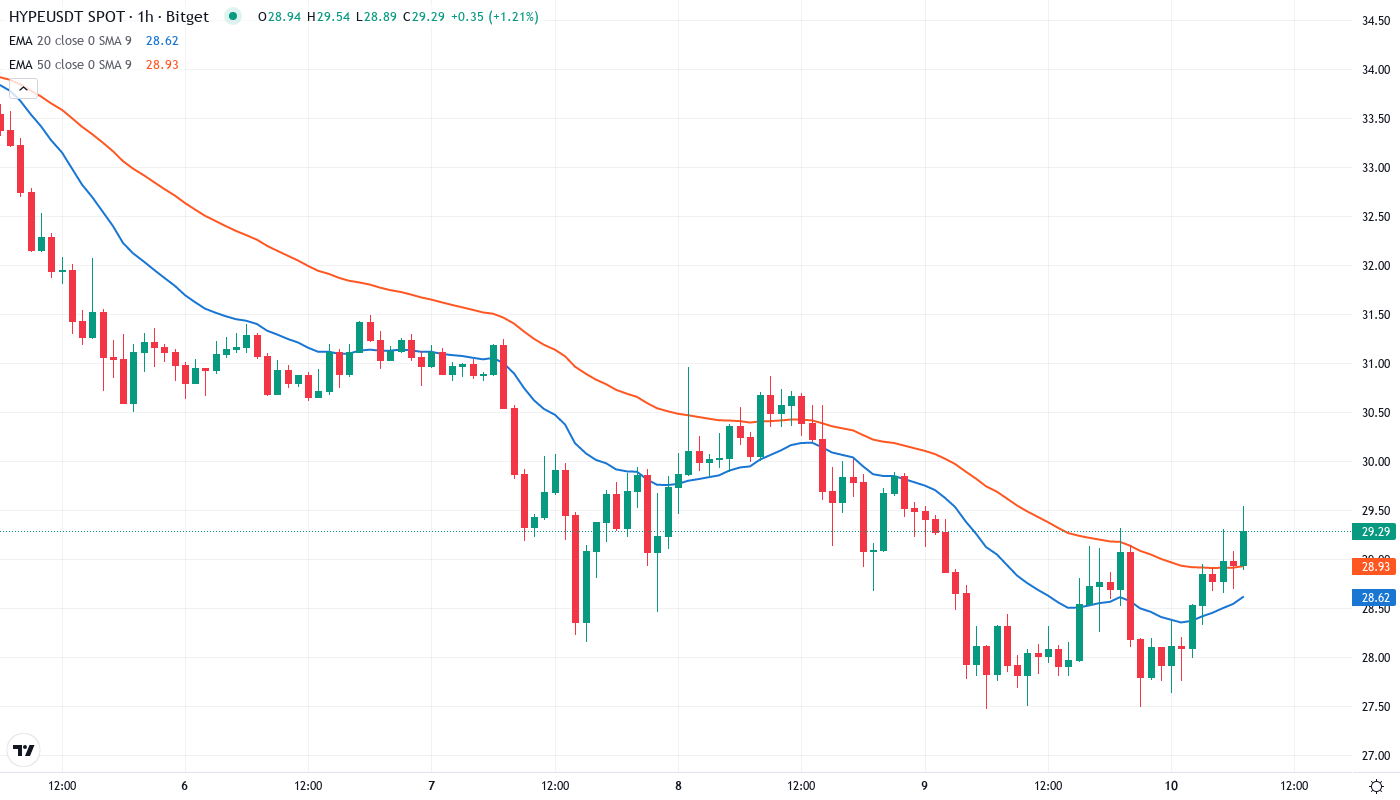
Price action tells a clear story through the moving average structure – HYPE trades below the entire EMA ribbon for the first time since launch. The token sits beneath the 10-day ($34.06), 20-day ($36.27), and crucially the 50-day EMA at $38.84, painting a definitively bearish picture. Each average that previously provided support during the uptrend now acts as resistance on any bounce attempts.
Most significant is how the 20-day EMA rejected price twice during this week’s decline, confirming its flip from support to resistance. That former support area at $36.27 now transforms into a red line that bears will defend aggressively. The 50-day EMA looms even higher at $38.84, creating multiple resistance layers that make any sustained recovery challenging despite the buyback program and USDC cross-chain integration providing fundamental tailwinds.
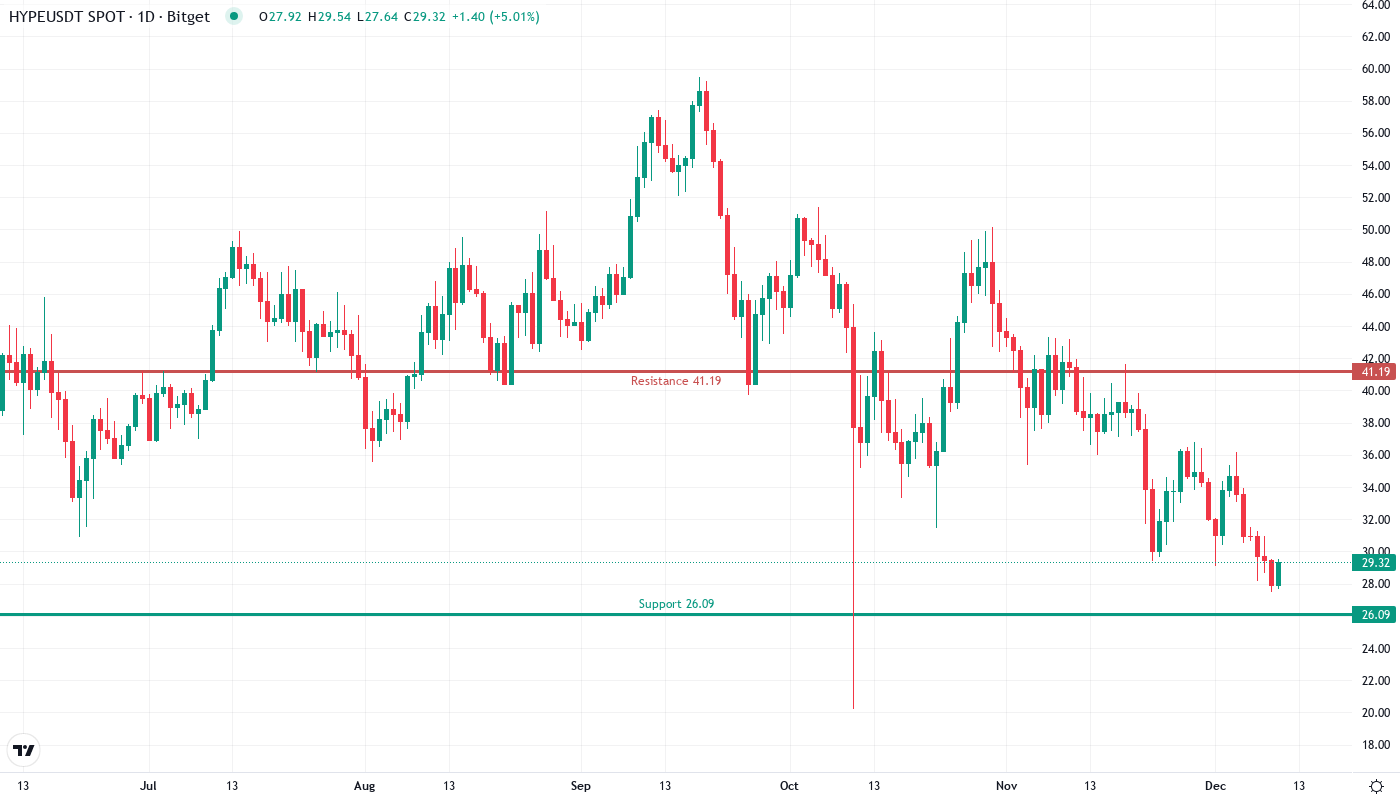
Support Vacuum Below $30 After December High Rejection
Resistance stacks heavy between current price and the December highs, with the immediate ceiling at $35.29 where the monthly pivot sits. Above that, the $38.84 level hosts both the 50-day EMA and psychological round number resistance. The monthly high at $41.96 feels distant given the technical damage, requiring a 42% recovery just to retest those levels.
On the downside, support looks dangerously thin below the psychological $30 level. The monthly low at $27.47 offers the next technical floor, but that’s only $2 away – not much cushion if selling accelerates. Below that sits an air pocket down to $20, as HYPE lacks established support zones from its brief trading history since the November launch.
The market structure reveals sellers firmly in control as long as price remains below $35.29. Any bounce that fails to reclaim this level likely attracts fresh shorts, while a breakdown below $27.47 could trigger another leg lower toward $20. The $30 million buyback provides some bid support, but technical traders appear to be overwhelming any treasury buying pressure currently.
Bears Target $27.47 as Buyback Bid Meets Technical Selling
Bulls require a decisive close above $35.29 to neutralize the immediate bearish pressure and open a path back toward the 20-day EMA at $36.27. Such a move would need to be accompanied by ADX rolling over below 25, signaling the downtrend is losing momentum. The cross-chain USDC integration could provide the fundamental catalyst if adoption metrics impress.
The bearish scenario triggers if HYPE loses the psychological $30 support on heavy volume, likely flushing stops down to the monthly low at $27.47. A break below that level would create a measured move target near $20, representing another 32% downside from current levels. This would trap recent buyers who entered on the buyback news and leveraged trading launch.
Given the oversold RSI, proximity to monthly lows, and $30 million in buyback ammunition, the most probable near-term outcome is a relief bounce toward $32-33 before sellers regroup at the monthly pivot. However, until HYPE reclaims $35.29 with conviction, the technical structure favors further downside despite the protocol’s fundamental progress.