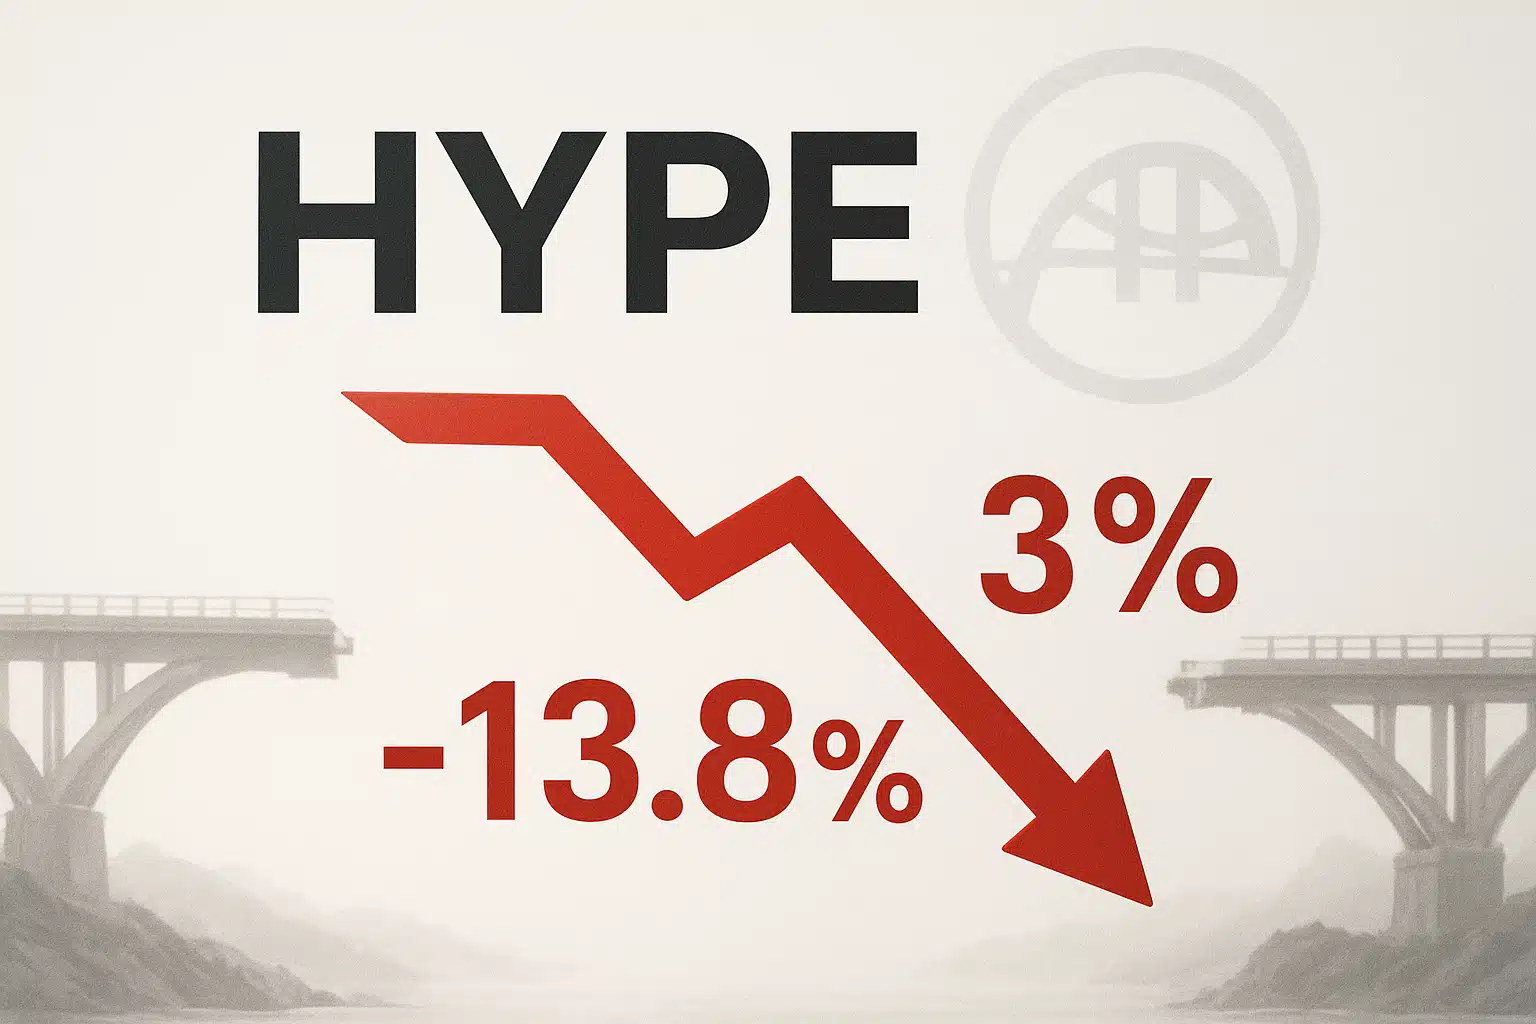
HYPE Plunges 13.8% as Bridge Closure Rattles Market After $4.9M Trading Disaster
Market Structure Shifts Lower
- HYPE plunges to $39.20 due to a withdrawal freeze and huge POPCAT trade losses
- Momentum indicators came back to normal after overbought levels as panic selling ruled the market
- There is a support structure between $34.14 and $38.76, whereas resistance is near $42

Hyperliquid’s HYPE token experienced a severe 13.8% dip to $39.20 on a monthly basis after the platform declared a halt on USDC withdrawals due to a $4.9 million POPCAT leverage blowout. The profit-taking from the previous highs of $50.15 in December led to the triggering of stop-loss cascades as traders sold their stocks all in a hurry and find the bridge only closed. The overall querstoin among traders is whether the $38.76 support area will hold, after the platform deal a savage blow to their trust?
| Metric | Value |
|---|---|
| Asset | HYPERLIQUID (HYPE) |
| Current Price | $39.20 |
| Weekly Performance | -5.20% |
| Monthly Performance | -7.61% |
| RSI (Relative Strength Index) | 45.2 |
| ADX (Average Directional Index) | 24.1 |
| MACD (MACD Level) | -0.88 |
| CCI (Commodity Channel Index, 20-period) | -90.33 |
RSI Plummets to 45.17 – Fastest Reset Since Token Launch
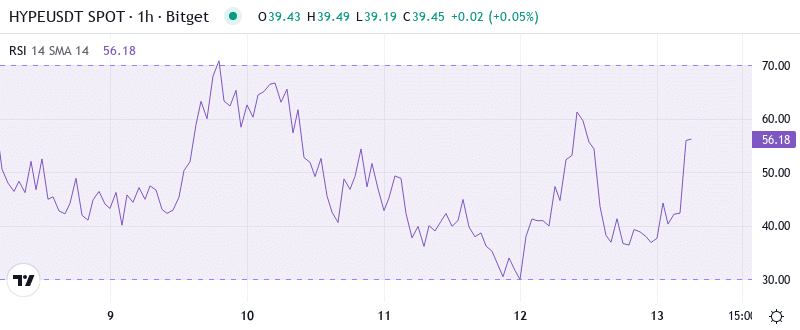
At the moment, the oscillator is sitting at 45.17; hence, traders can conclude that momentum has reached the resetting point from being in the overbought zone just in a few weeks. This quick turnaround from higher than 70 to a neutral state was the most impressive RSI drop in HYPE’s brief history. The pace of this fall is in line with the standard capitulation format that is usually seen when highly leveraged positions are forcibly eliminated.
As per swing traders, the balanced RSI indicates that the panic phase might be ending but there is a lack of conviction. In the earlier times, such scenarios where RSI dropped so fast in crypto markets have been the indicators of the local bottoms – if there is no terminal fundamental damage. Even with the bridge closure still being a matter of concern and the user’s trust destroyed, the traction from momentum is not sufficient for the recovery.
ADX at 24.10 Signals Trend Building After Chaos

Trend strength has an ADX reading of 24.10, which is at the threshold just below the critical 25 that separates the ranging markets from trending ones. The indication is that we are now moving to the second stage of the economy, such as from an economy that is shock-driven and collapsed, to an economy that is more orderly. This score reflects that the sellers are still dominating the market, but they are not able to reach the levels beyond 40 that would characterize such a market by climactic washouts.
Consequently, day traders ought to switch to trending strategies should mean reversion plays. The trajectory of the ADX reflects other DeFi protocol crises where the initial panic transgresses to solid bearish pressure. In that way, the absence of extreme ADX readings signifies that this selloff could still go on as the long positions that are trapped continue to liquidate gradually instead of all at once.
Price Trapped Below Entire EMA Ribbon Since Bridge Freeze
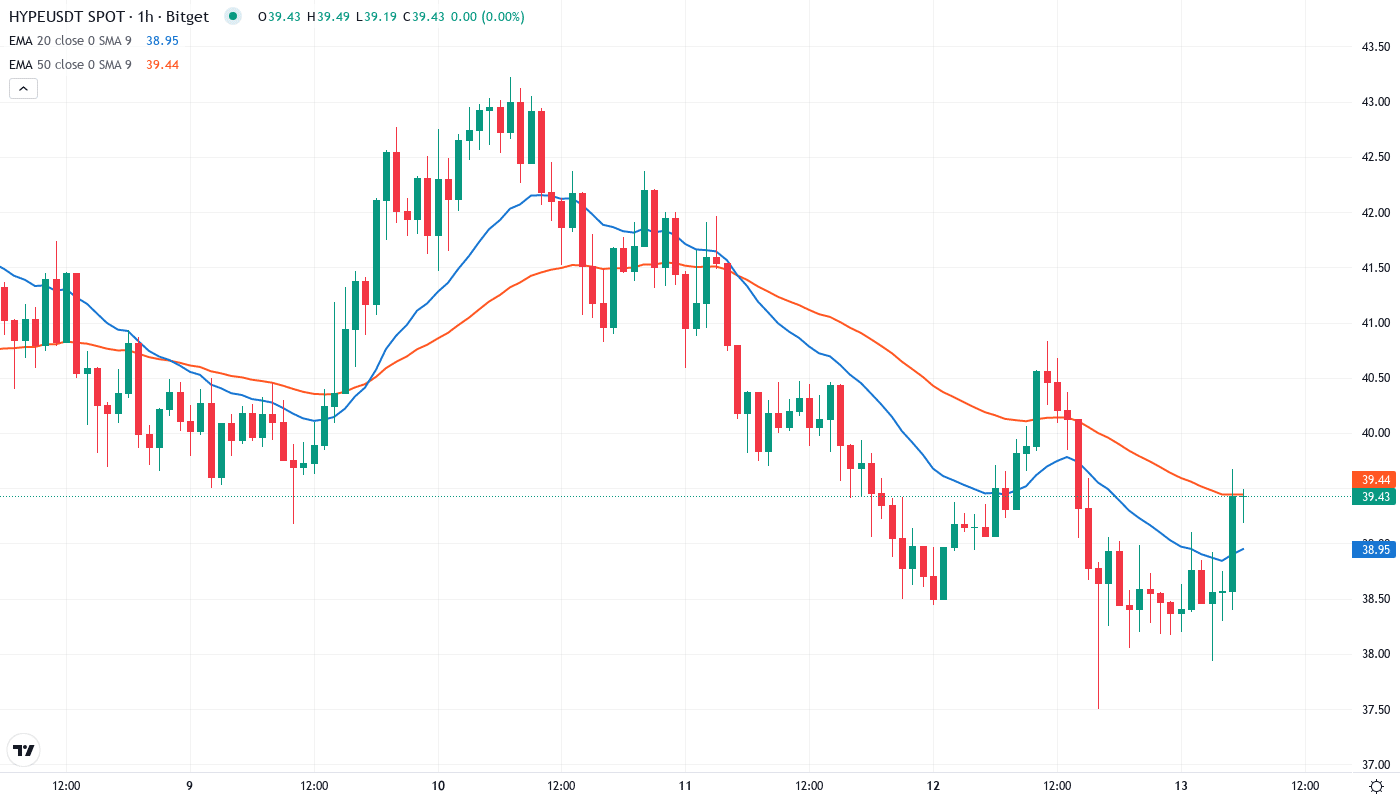
A technical violation of HYPE evident by the moving average structure is the effect of the POPCAT incident. The HYPE is trading below every important EMA – 10-day at $42.64, 20-day at $41.52, and most importantly, the 50-day at $42.44. The entire breakdown of support occurred just a couple of days after the announcement of the withdrawal freeze, when all averages changed from support to resistance.
It is especially interesting to note that the 20-day EMA at $41.52 persists, standing in the way of three attempts for recovery during the week. That is now an imaginary red line, a former support area, that bears defend very skillfully. The consolidation of all short-term EMAs around $42 manifests an impenetrable wall that bulls are required to turn around definitively to change the story from crisis to recovery.
$38.76 Support Tested Repeatedly as Bears Target $34.14
Improvements in the initial barriers hold the brunt between $40.98 and $42.93, where the weekly pivot meets the EMA cluster. Meanwhile, sellers defended this area with belief timing of the week on Wednesday’s relief bounce, adding the volume to make it the new ceiling. The psychological $40 mark is another one that complicates any attempts of recovery.
Bulls are the current guards of the $38.76 support level which has already withstood selling pressure four times after the bridge was closed. Under that, the following major support is on the monthly S1 pivot of $34.14 that is roughly 13% lower. This point actually adds to its importance because it is closely related to the pre-pump funds accumulation areas from the first December.
According to the market structure, there is a triangle being formed which is a compressed triangle that stands between $38.76 support and $42 resistance. This type of formation is usually resolved in a very short time, generally within a few days, but due to the fundamental backdrop of halted withdrawals and shattered confidence, it is more likely that continuation lower is favored than reversal. Volume profiles demonstrate that very little accumulation has occurred at the current levels, which means that the institutions are waiting for a definite answer on whether or not the platform is operational.
Bulls Need Bridge Reopening and Close Above $42 to Salvage Recovery
HYPE needs to recapture the 20-day EMA at $41.52 on volume in order to carry out its bullish targeting on the psychological $45 level, which is the place where it started the breakdown in December. Nevertheless, this situation demands the prompt trigger of the bridge function restoration and explicit details regarding the POPCAT losses. In the absence of operational clarity, technical bounces are still a reason to sell.
The bearish domino effects are triggered when the price loses $38.76 support on the volume – this will lead to stop losses being hit down to $34.14 where the monthly S1 is located. This kind of move would entrap the earlier dip-buyers and could even lead to the price being pushed down to the $30 psychological support level. Moreover, if any negative regulatory implications arise after the trading fiasco, it might speed up this situation.
Due to the scale of operational problems ithas dealt with and loss of trust, the immediate trajectory that HYPE will take is scratching between $38-42 while the site handles the crisis. The end of the freeze on the bridge is what specifies if this range of motion breaks upwards towards healing or downwards towards more hand-in-the-air moves. To the point where withdrawals do not go back to their typical normal rates, sellers still have power.