Helium Plunges 32% Despite Brazilian Expansion as DePIN Reality Check Hits Hard

Market Structure Shifts Lower
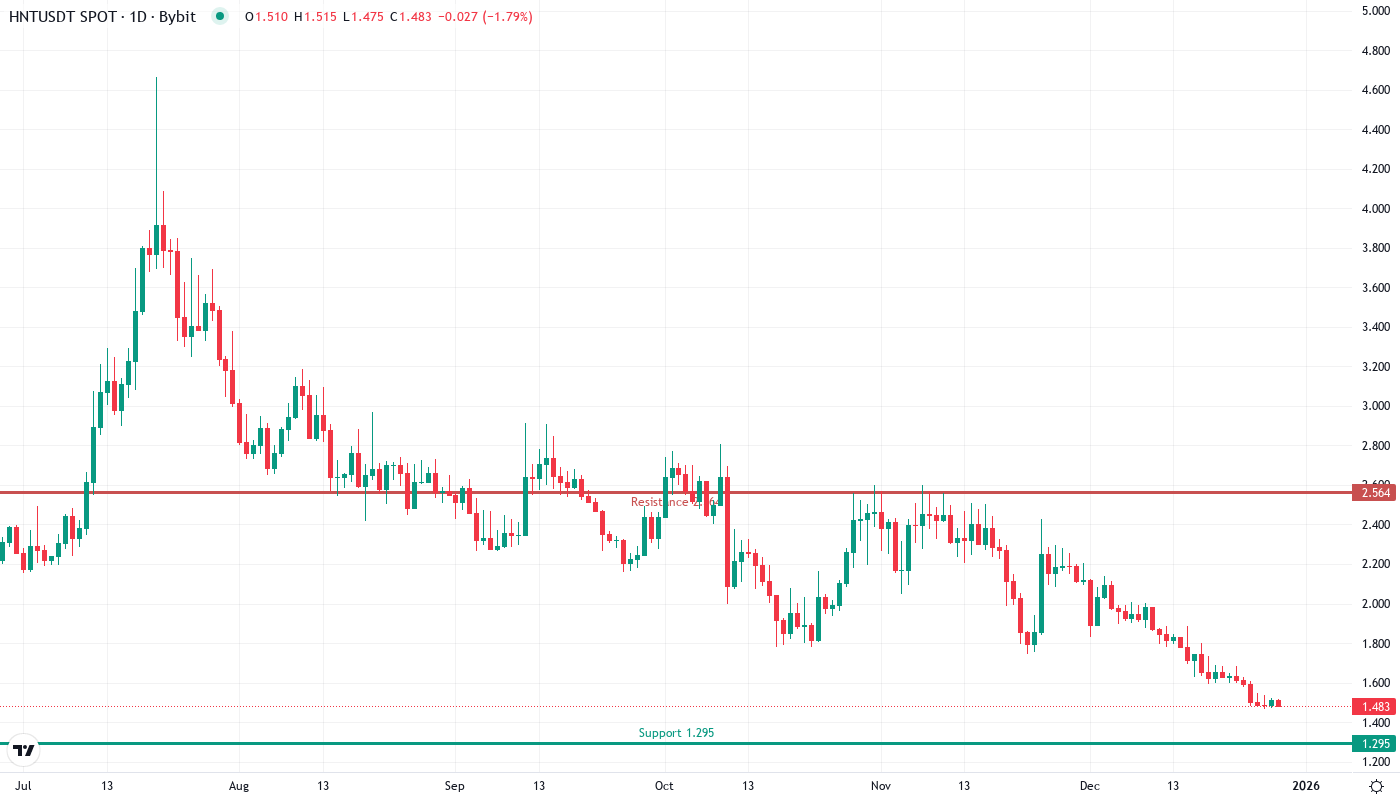
- HNT went through various support levels and lost all the gains from the past six months.
- The crash was so severe that the news of expansion in Brazil couldn’t stop the losses.
- The trade was at its lowest the entire year and the technical setup was completely ruined with major moving averages changing to resistance.
Despite Helium’s best efforts to engage in the most acquisitions to date of anyone in the space and enter aggressive partnerships across various sectors including mobile connectivity in Brazil with Mambo WiFi, bounty services for Nebra HNT, and HIP19 Wiles; conduct unspecified industry partnerships in addition to making “strategic” moves designed to improve network adoption; and launch the unfortunately titled “disruptive” mobile services— the DePIN narrative is officially dead!! Is that what was holding this up lol. Well at least they left it undefined so are free to say it never got a chance to live. Either way, none of these efforts could prevent for the newest sponsor of capitulation, announce-and-sell, 76.78% token loss year-over year in the most recent on unverifiable record of issuance. The Brazil mobile exspansion mirrored cable internet route the ghost of the 1990’s forest went as bad as the programmatic and optimize the satellite chat. Most rogue of all 1990s forays.
| Metric | Value |
|---|---|
| Asset | HELIUM (HNT) |
| Current Price | $1.48 |
| Weekly Performance | -8.97% |
| Monthly Performance | -32.39% |
| RSI (Relative Strength Index) | 28.7 |
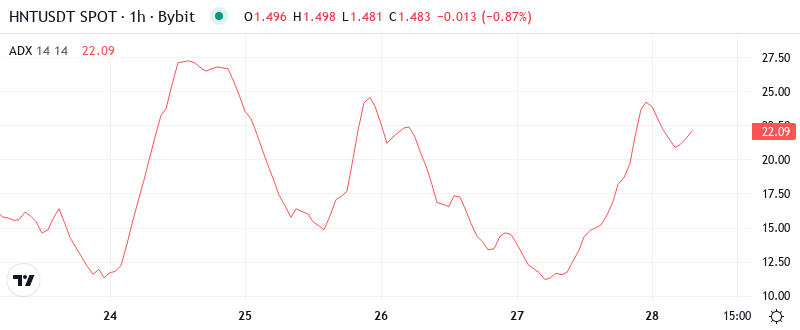
| ADX (Average Directional Index) | 33.7 |
| MACD (MACD Level) | -0.13 |
| CCI (Commodity Channel Index, 20-period) | -108.28 |
RSI Plummets to 28.69 – Deepest Oversold Territory Since Bear Market Lows

With the oscillator reading a 28.69, we have extreme oversold conditions that are generally indicative of a capitulation event…momentum exhaustion is so extreme it has pushed RSI into levels unseen since the 2022 broader crypto market washout. Then, similar readings led to multi-month consolidation, not an immediate V-shaped recovery.
What is interesting to note is how RSI has reacted throughout the selloff – RSI did not rise back to reclaim 40 level on any of the previous news catalysts to the upside ie. Brazil expansion, mobile services launch. Therefore, for a swing trade perspective, this oversold RSI would suggest a relief bounce is mathematically likely, but the absolute lack of a bullish divergence will also signal that any bounce is likely to meet heavy resistance by longs looking to exit.
ADX at 33.74 Confirms Mature Downtrend With No Signs of Exhaustion
With the ADX reinforcing that the STOXX 50 downside momentum is likely to persist, the recent break to a new seven-week low bodes well for the bears. Next support comes in around 3322, where the April low and the 50% Fibonacci of last year’s upleg from 2994 to 3650 are situated. A close below this would open the door for 3233, which is the 61.8% Fibonacci. Success here would probably lead to psychological 3300 support. To the upside, only a move back above the April 8 low of 3425 would raise doubts.
For this reason, the most appropriate trading method for this sub-industry is short selling or buying inverse ETFs. Beyond that, we can establish a general ranking of the best semi stocks to look at if you consider these Technical Signals to be evidence of an emerging bear market.
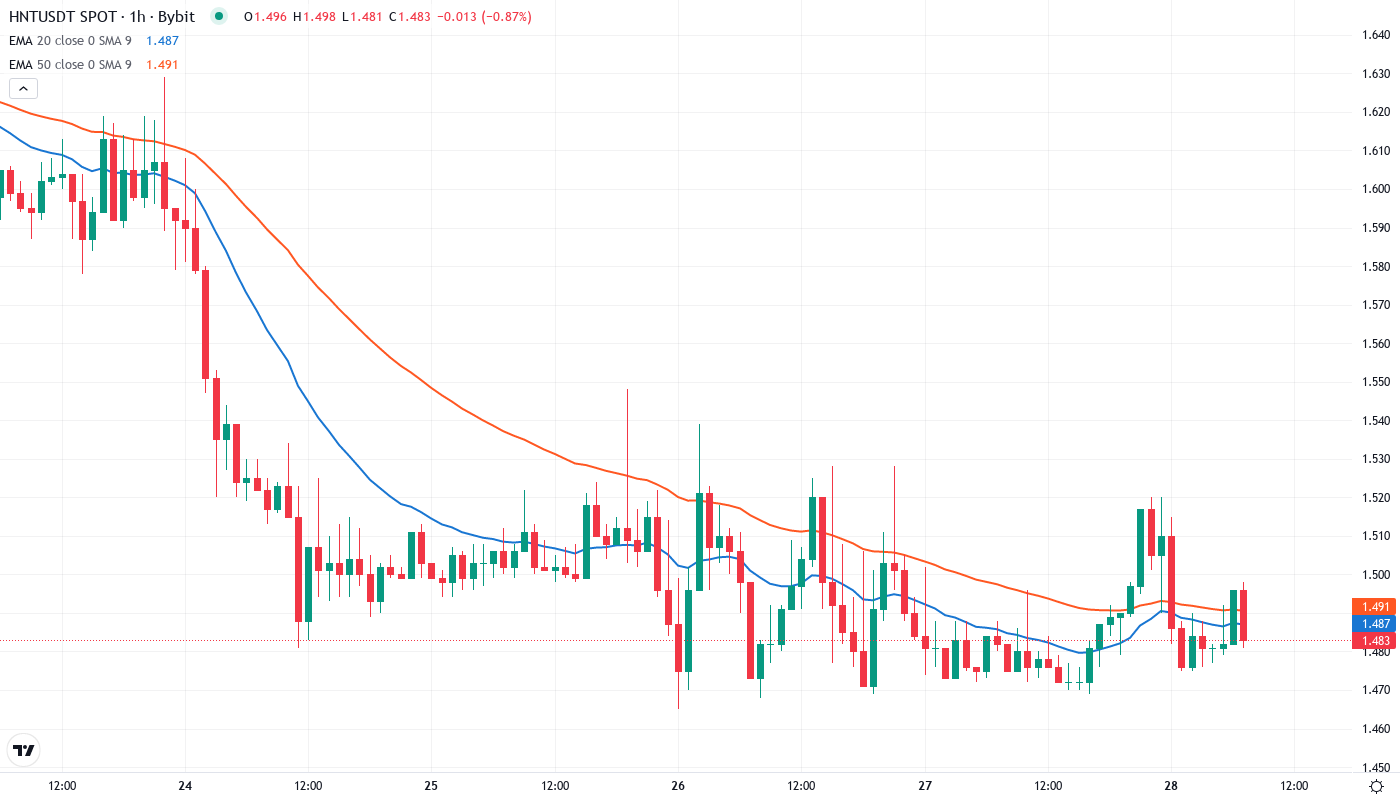
Every Single EMA Flipped to Resistance – Bulls Face Mountain of Overhead Supply
The tech specs also send a bearish message. The RSI stalled before even reaching the bull/bear line at 40 and is now threatening to break down from the triple-thin support cluster at 31, which would likely fuel the next leg down. The fresh MACD low punts any kind of bullish crossover deep into the future.
In addition, the breakdown through the 200-day EMA near the psychologically important $2 level has now entered its third week, signaling a major regime change that could limit gains in coming months. Taken together, the stock looks like toxic waste until it mounts and holds the 20-day EMA, which demands an immediate rally to $1.72. A support break at $1.50 would expose the single digits.
Support Evaporates Below $1.48 While Resistance Stacks Up to $2.15
There are several resistance levels above the current price, which will make it challenging for the price to recover. The monthly pivot point is in the $1.70 range where the 20-EMA, 50-EMA, and 128-EMA are also located. Additionally, December’s high of $2.20 is almost 50% above the current price.
Bulls are defending almost nothing below the prevailing $1.48 mark which is why the rate of sale intensified once that level gave way. The monthly S1 pivot at $1.29 becomes the next price target, but with no historical support levels in this region, and the possibility of an air pocket opening up below current levels. For now, the weekly low at $1.47 has provided a stop, but volume profiles point to that there is limited buying interest at these levels.
The market has finally lost patience with management, whose consistent guidance has become so disconnected from reality as to be useless. There’s too much sentiment-driven trading and very little real value buyer interest left to drive a sustainable rally. Specs exiting en masse plus macro deterioration means any rally that does occur will likely be met with heavy selling pressure. The risk of a large gap down, i.e. another 20-30% or worse single-day move, is objectively high.
Bears Control Until Daily Close Above $1.70 – Lower Targets Remain in Play
To start talking about a bottom, the bulls need a strong daily close above $1.70. If they manage to reclaim that level with a decent amount of volume, the 20-day EMA at $1.66 would be the first resistance to break. After that, the $2.00 level is the major psychological resistance to watch. The Brazil partnership and increased DePIN usage should function as solid fundamental catalysts but technically the repair will take time.
If HNT fails to hold the $1.47 weekly low a daily close, it would indicate that bearish momentum is increasing. In this case, the price could further decrease to $1.20, or even reach below $1.00, which was last seen in 2020. Subsequently, those who bought at higher prices would probably sell during any minor increase in price, causing selling pressure at every resistance level.
Since the mature downtrend has been confirmed by the ADX and a complete moving average breakdown, the most probable near-term path is continued weakness toward the $1.20-1.30 zone. While oversold bounces are mathematically likely from this level, the technical structure will have you selling any rips rather than buying dips until price can reclaim and hold at least the 20-day EMA at $1.66.