HBAR Tests Critical Support at $0.136 as 9M User Milestone Meets Technical Resistance
Market Structure Shifts Lower
- HBAR dropped 7.67% this week despite reaching 9 million users and Georgian government adoption
- RSI sits at 43.49 on the daily timeframe, signaling momentum exhaustion after December’s rally attempt
- Price trades below all major moving averages with the 20-day EMA at $0.146 acting as immediate resistance
Hedera’s HBAR finds itself at a crossroads as fundamental progress collides with technical weakness. The token shed 7.67% over the past week to $0.136, erasing gains from the Georgia real estate registry announcement and leaving holders questioning whether the 9 million user milestone can translate into price appreciation. With momentum indicators flashing exhaustion signals and price trapped below a descending wall of moving averages, the main question for traders is: can HBAR’s expanding real-world utility overcome the current technical headwinds?
| Metric | Value |
|---|---|
| Asset | HEDERA (HBAR) |
| Current Price | $0.14 |
| Weekly Performance | -7.67% |
| Monthly Performance | -19.50% |
| RSI (Relative Strength Index) | 39.7 |
| ADX (Average Directional Index) | 19.8 |
| MACD (MACD Level) | -0.01 |
| CCI (Commodity Channel Index, 20-period) | -81.88 |
Momentum Exhaustion at 43.49 Matches Pre-Rally Levels From October
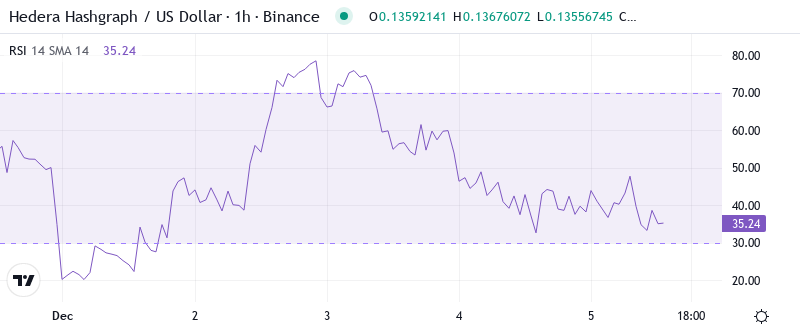
RSI sits at 43.49 on the daily timeframe, marking a significant retreat from the overbought conditions that characterized HBAR’s late-November surge above $0.19. This reading places momentum squarely in bearish territory without reaching oversold extremes – a zone that historically preceded both sharp rebounds and deeper corrections for HBAR. The oscillator’s failure to hold above 50 despite positive news flow reveals underlying distribution as larger holders used the Georgia announcement bounce to lighten positions.
Looking back at similar RSI configurations, October’s dip to 44 preceded a violent 40% rally once buyers stepped in. However, that setup benefited from a rising 50-day EMA providing support, unlike today’s descending average structure. So for swing traders, this balanced-yet-weak RSI reading suggests waiting for either a capitulation spike below 30 or a convincing reclaim above 50 before committing capital – the middle ground here offers poor risk-reward with momentum lacking clear direction.
ADX at 19.82 Confirms Choppy Conditions Despite High-Profile Partnerships
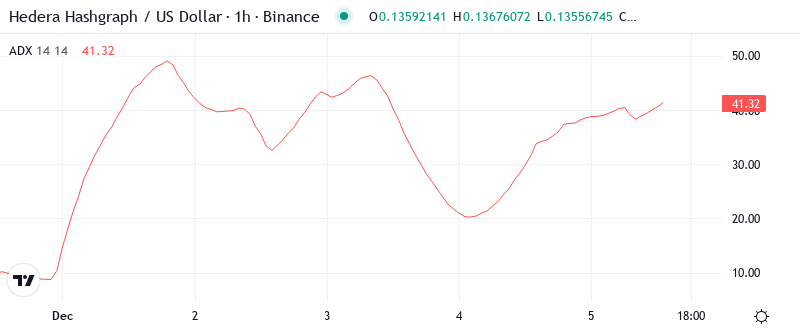
At the level of 19.82, the ADX entry indicates that HBAR remains trapped in a directionless grind despite the flurry of partnership announcements. This weak trend strength reading explains why price failed to sustain any meaningful rally attempts – there’s simply no conviction behind moves in either direction. Basically, the market is telling us that neither the Georgia real estate registry news nor the 9 million user milestone provided enough fuel to break HBAR out of its ranging behavior.
The sub-20 ADX environment favors range traders over trend followers, with quick scalps between support and resistance offering better opportunities than directional bets. To clarify, the ADX is indicating that we need to see readings above 25 before any sustainable trend emerges – until then, expect continued ping-ponging between $0.128 and $0.146 as algorithms milk the volatility while real money sits on the sidelines waiting for clearer signals.
20-Day EMA at $0.146 Caps Rally Attempts After December Breakdown
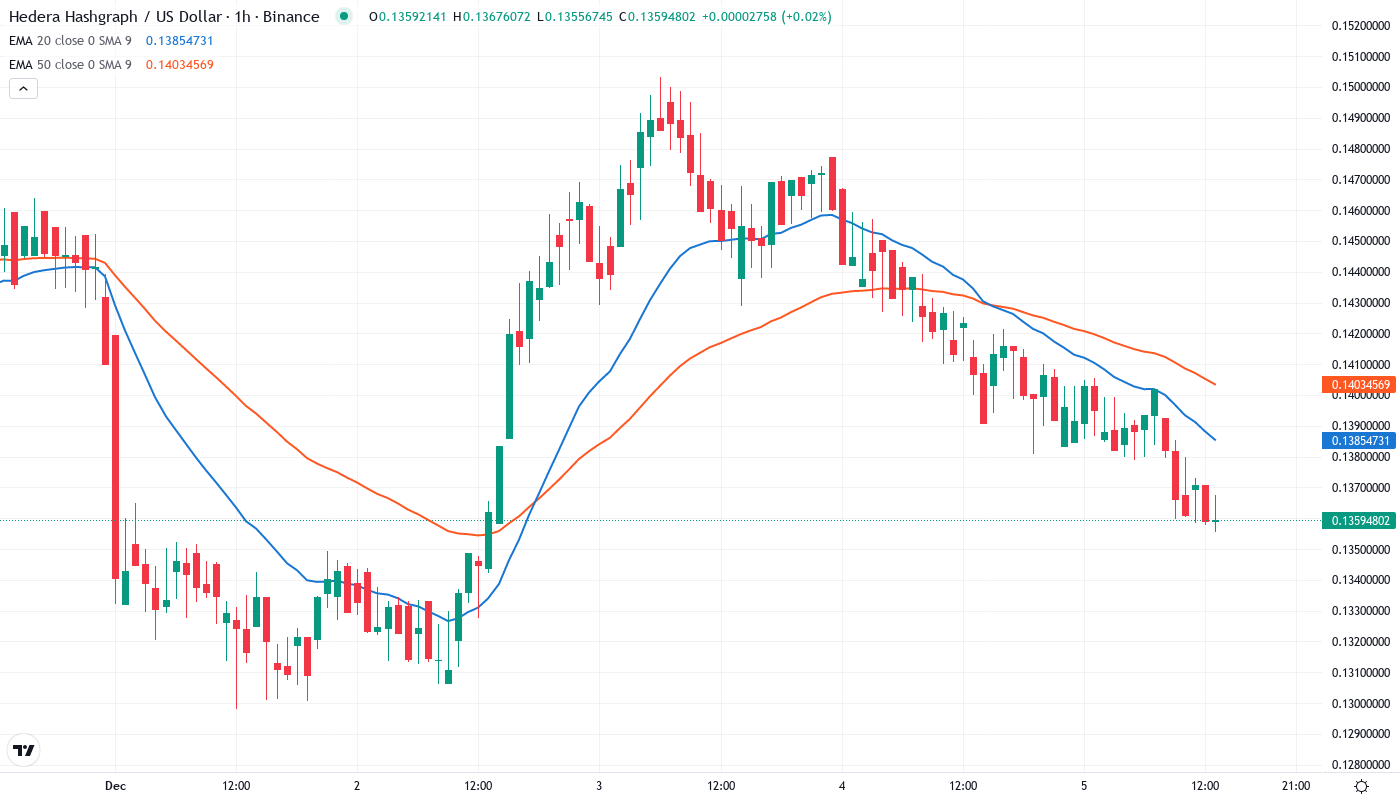
Price action through the EMA ribbons paints a bearish picture that contradicts HBAR’s fundamental progress. Currently trading at $0.136, HBAR sits below the entire moving average stack – the 10-day ($0.142), 20-day ($0.146), 50-day ($0.156), and crucially, the 100-day EMA at $0.164. This alignment represents a complete structural breakdown from the bullish configuration that supported prices above $0.18 just weeks ago. The Georgia partnership announcement briefly pushed price toward the 20-day EMA, but sellers emerged aggressively at that level.
What’s particularly concerning is how the 50-day EMA transformed from reliable support during the November rally to stubborn resistance after the December collapse. Each attempt to reclaim this level has been met with increased selling pressure, suggesting institutional distribution continues. That former support area at $0.156 now transforms into a red line that bulls must reclaim on volume to signal any meaningful trend reversal – until then, the path of least resistance remains lower.
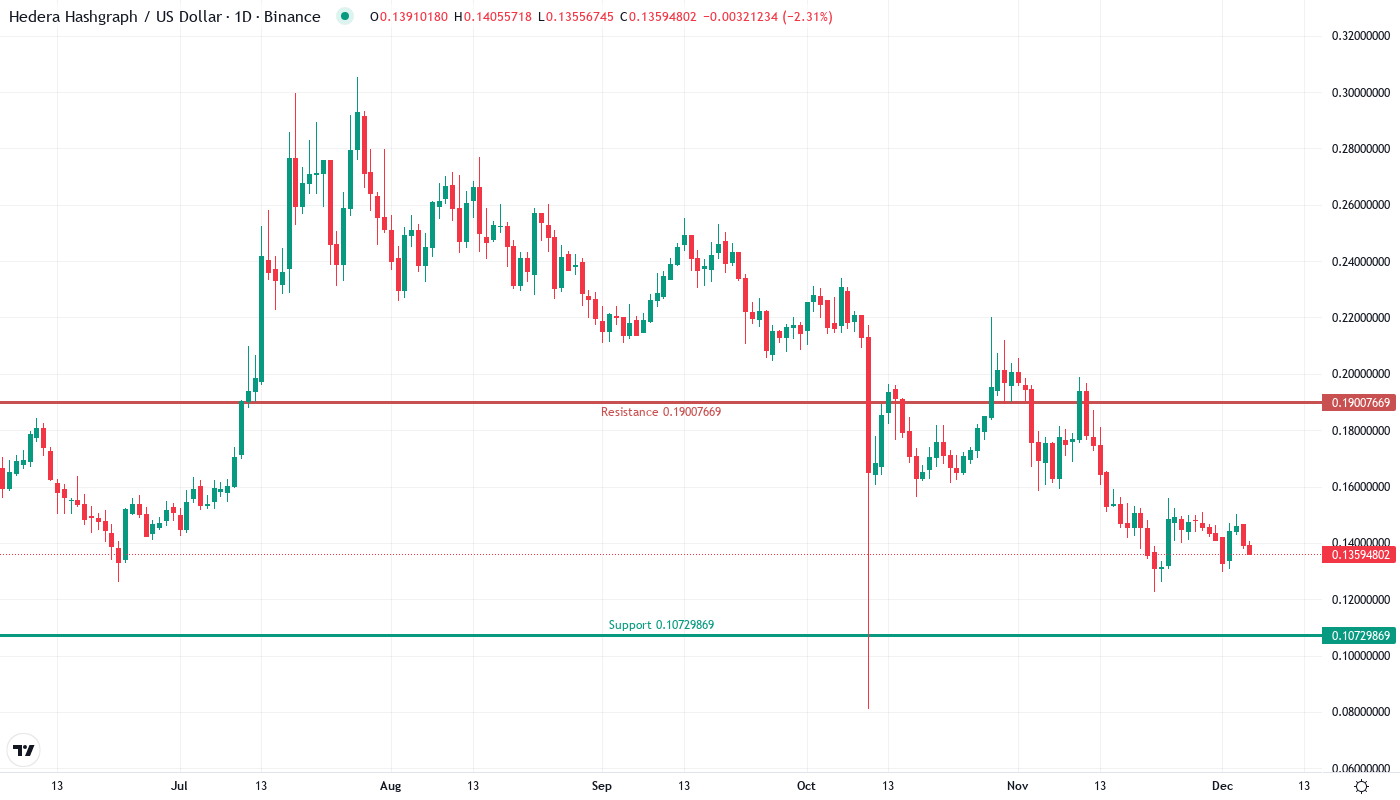
Resistance Stacks Between $0.146 and $0.164 Despite User Growth
The immediate resistance clusters densely between the 20-day EMA at $0.146 and the psychological round number at $0.15, where December’s breakdown accelerated. Above that, sellers have fortified positions at the 50-day EMA ($0.156) and 100-day EMA ($0.164), creating multiple barriers that require significant buying power to overcome. It is worth mentioning that the monthly pivot point at $0.156 reinforces this resistance zone, making it a triple confluence area where rally attempts are likely to stall.
Support architecture looks more promising, with buyers defending $0.128-$0.130 on multiple tests over the past two weeks. This level gains importance as it represents the 61.8% Fibonacci retracement of the October-November rally and aligns with August’s consolidation zone. Below that, the year’s low at $0.107 provides a final safety net, though reaching that level would likely trigger capitulation selling from recent buyers who entered on the Georgia news.
The market structure reveals a compression pattern between shrinking resistance at $0.146 and rising support at $0.128. This coiling action typically resolves with a sharp directional move – and given the bearish moving average configuration combined with weakening momentum despite positive fundamentals, the probability favors a downside resolution unless buyers can orchestrate a high-volume reclaim above $0.15.
Bulls Need Volume Surge Above $0.146 to Validate 9M User Narrative
Bulls require a decisive close above the 20-day EMA at $0.146 with ADX rising above 25 to confirm that HBAR’s expanding real-world utility can translate into price appreciation. Such a move would target the 50-day EMA at $0.156 initially, with the Georgia registry implementation and potential new enterprise partnerships providing fundamental catalysts for a sustained recovery toward $0.18.
The bearish scenario triggers if support at $0.128 fails on volume, which would likely flush positions down to the yearly low at $0.107. This breakdown would signal that even major adoption milestones can’t overcome the broader market’s risk-off positioning toward smaller altcoins, potentially trapping buyers who entered on the recent positive news flow.
Given the weak ADX reading and price compression between $0.128-$0.146, the most probable near-term outcome is continued range-bound trading as the market digests HBAR’s fundamental progress against technical weakness. Only a catalyst on the scale of a major enterprise deployment or regulatory clarity could provide the momentum needed to break this equilibrium decisively in either direction.