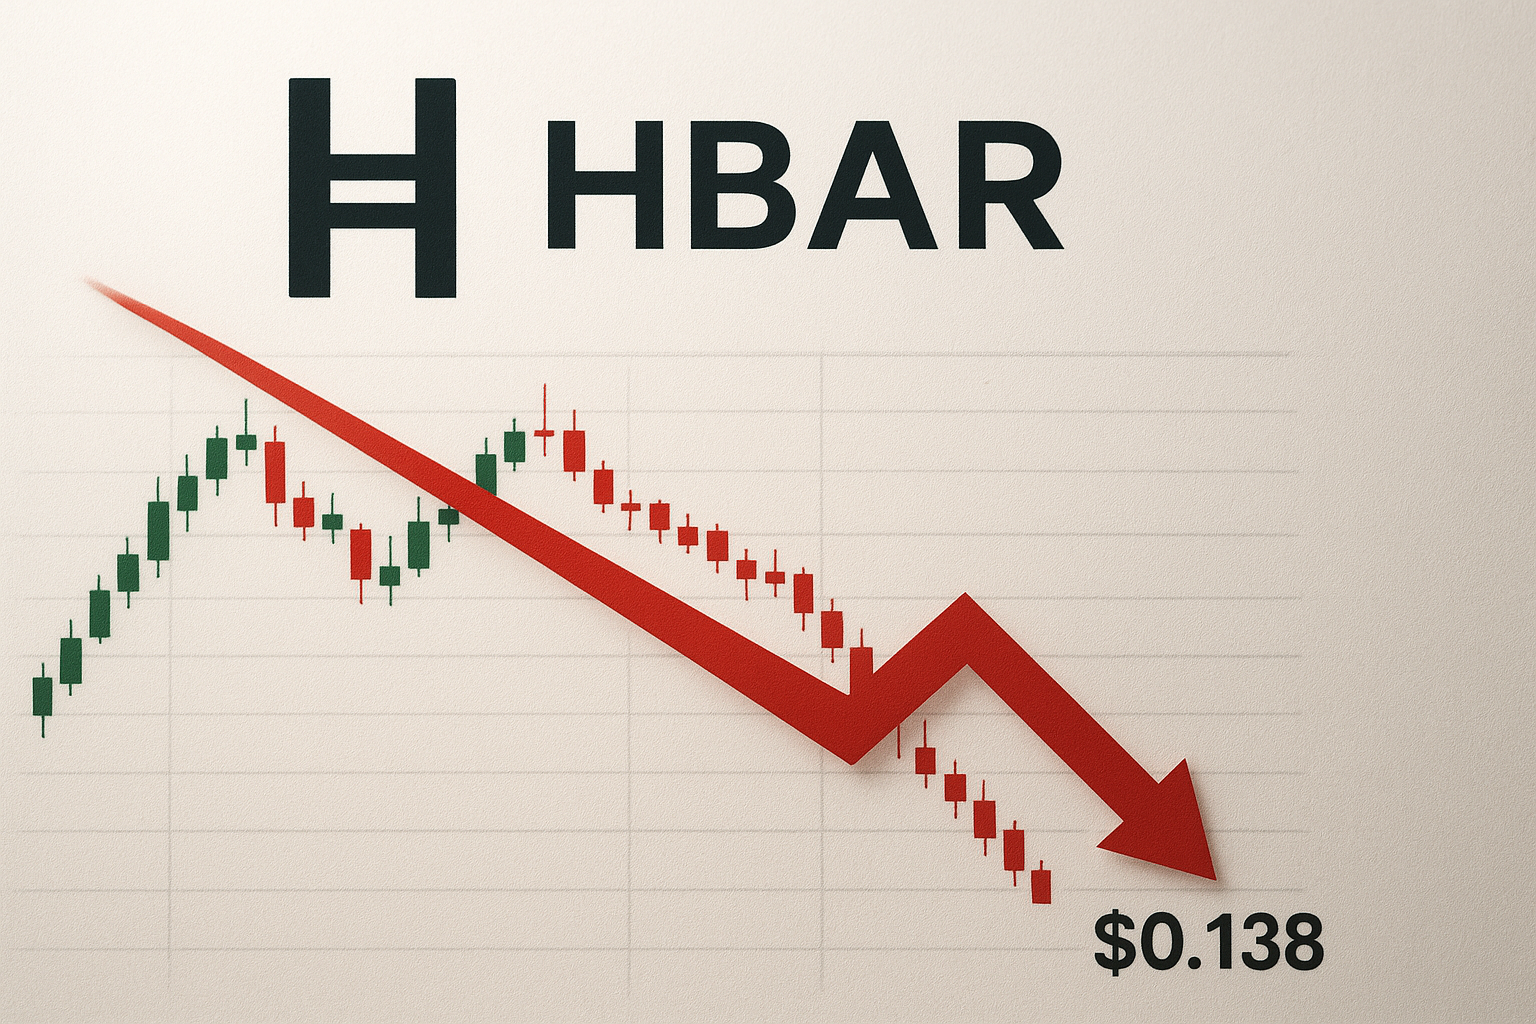
HBAR Plunges to $0.138 as Georgia Partnership Fails to Halt December Selloff
Market Pulse
- Despite Chainlink partnership integrating Hedera into Georgia’s national real estate registry, HBAR lost 17.7% last month.
- A series of lower lows and lower highs suggests a potential 68% decline.
- Price is trading 36.6% below three-month highs amid a significant downward trend.
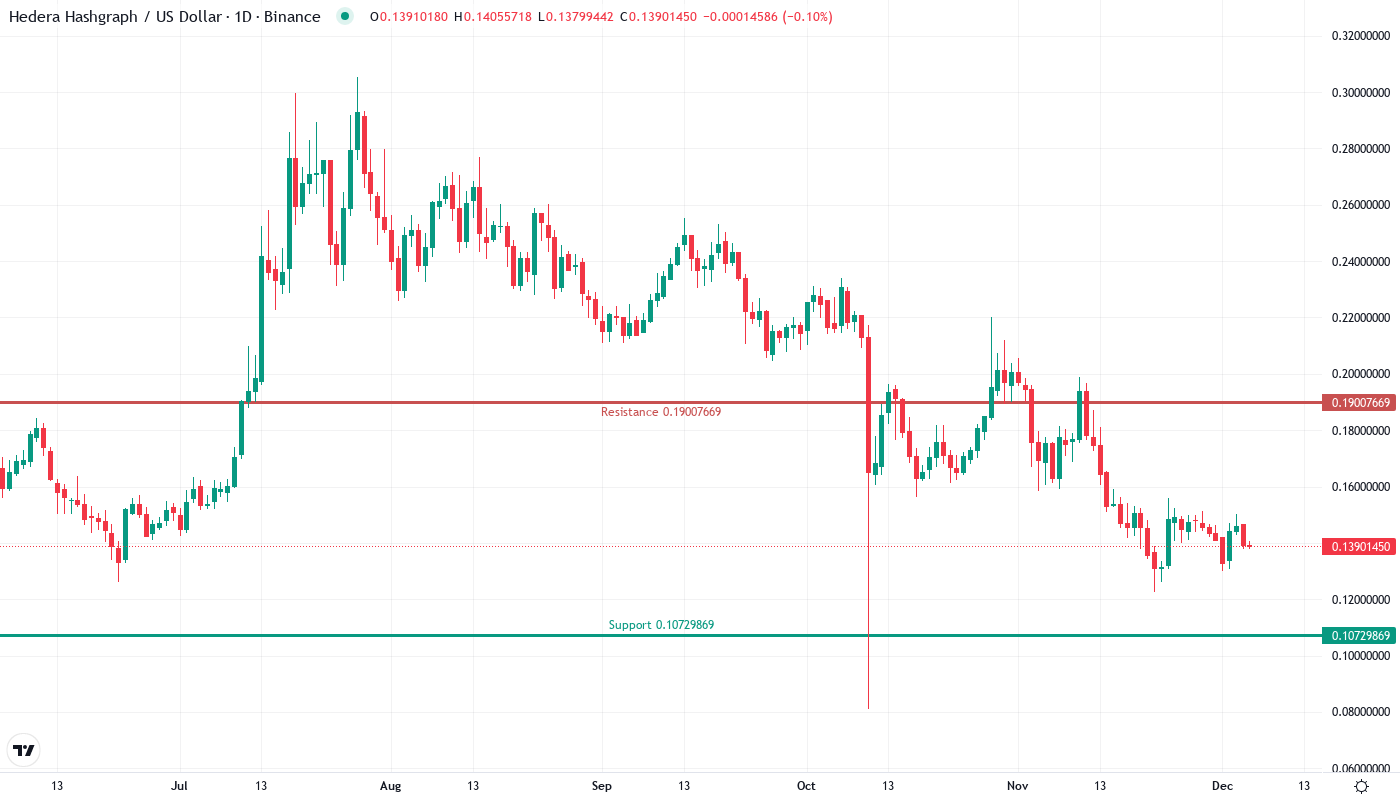
Despite a major milestone being achieved via a Chainlink partnership that integrated the Hedera Hashgraph public ledger into Georgia’s national real estate registry, HBAR lost 17.7% last month alone. A series of lower lows and lower highs is likely to continue, which could lead to an overall 68% decline. The recent lowest daily close (21st September) should not amount to the eventual bottom. Price action is still trading 36.6% below the highest levels in over three months. A significant trend lower is currently underway, with the most recent top failing to reach the 200-day moving average. This declining average is fast approaching the falling 50-day moving average.
The HBAR token of Hedera has declined by 17.7% over the last month to $0.138, although the network was recently chosen by Georgia to transfer its national real estate registry onto the blockchain. The brutal plunge from December’s peak of $0.198 wiped out roughly three months of appreciation and trumped the positive aspects of the government deal. Now, the key query for investors is whether or not the Georgia news will now act as a price floor, or if the technical picture will push prices toward $0.10.
| Metric | Value |
|---|---|
| Asset | HEDERA (HBAR) |
| Current Price | $0.14 |
| Weekly Performance | -5.63% |
| Monthly Performance | -17.73% |
| RSI (Relative Strength Index) | 41.3 |
| ADX (Average Directional Index) | 19.6 |
| MACD (MACD Level) | -0.01 |
| CCI (Commodity Channel Index, 20-period) | -57.79 |
RSI at 41.3 Signals Capitulation – Matches August Bottom
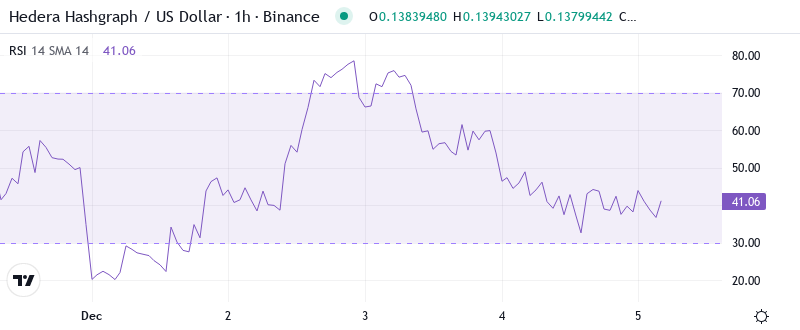
The 14-day RSI currently oscillates at 42.6, remaining in a bearish position and signaling more downside is possible. While oscillators are reading overly bearish for the time being, a loss of the psychological $0.07 could allow for a further decline to next support at $0.063. This region has performed well as support for much of the post-August rally and includes the tops of both the January 2019 and April 2021 rallies.
The interesting part is how RSI responded to the Georgia news, hardly flinching from oversold territories, meaning the recent partnership news did not have an impact on momentum dynamics. Hence, for swing traders, this “Goldilocks” situation amid timeframes implies that trying to catch falling knives still exposes one to risk until daily RSI supports a 45+ rebound. The more the daily RSI remains a stranger to both overbought and oversold territories, the riskier the situation.
ADX at 19.6 Keeps Range Traders in Control
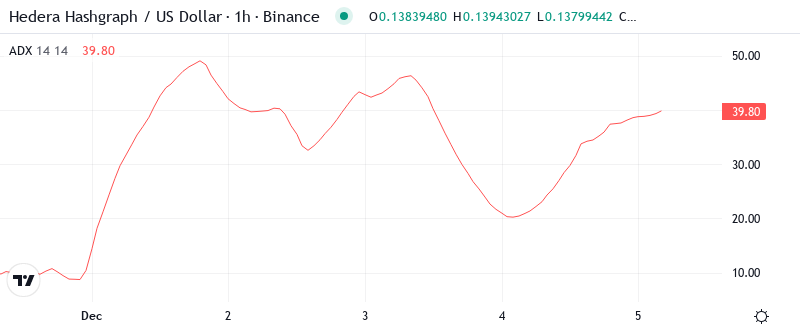
With the ADX below 20, trend strength has devolved into choppy, sideways action. When in this sub-20 territory, neither bulls nor bears have strong convictions – ideal conditions for ping-ponging between support and resistance. The indicator hasn’t registered trending strength above 25 since the early November rally attempt.
In other words, the ADX is suggesting that while the Georgia partnership is creating some important fundamental reasons to take action, overall there isn’t a bias as to which way the market seems to be headed just yet among investors. So day traders will want to tailor their approach to taking a series of in-and-out scalp trades in shares of SNN between $0.13-$0.15 and to look for those trades to be in the direction of the breakout over the next week to 10 days assuming one occurs. An ADX reading over 25 would suggest a real emerging trend to the upside or the downside.
Price Trapped Below Entire EMA Cloud Since December Peak
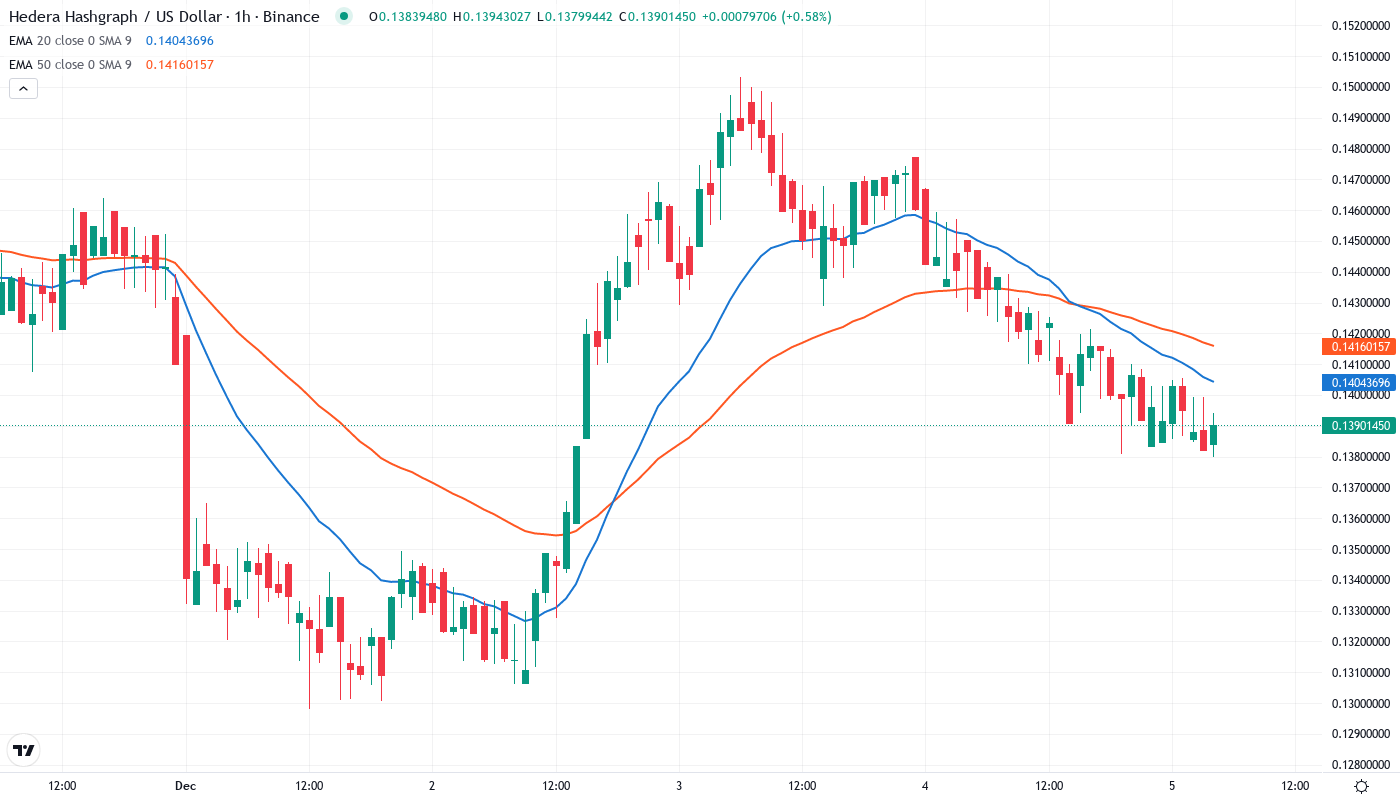
The daily RSI remains <50 which leaned bearish while the “50” (from the index) and 20-day EMA also act as declining resistance. A push through those should confirm the next leg up. The SOW remained positive if relatively flat, and the -DI just barely crossed over indicating a short bearish period. The ADX began to show a bottoming pattern.
Taking a longer perspective, the 100-day EMA is at $0.140, which wasn’t much support on the low hit today. The zone that had previously acted as resistance around $0.140 now serves as a defining line for bulls to hold; if they lose it, the 200-day EMA at $0.163 is a moot point as price likely free falls towards the $0.10 psychological support. And for reference, HBAR hasn’t actually traded above its 200-day EMA since April, so the bearish structure is very much still in play.
Support at $0.107 Emerges as Critical Line After 36.6% Plunge
There is also a bearish view on this, according to the immediate resistance, if the price turns down from the current level or the overhead resistance, the XRP/USD pair can again dip towards the $0.12 support. A break below this level can result in a decline to $0.10.
Bulls are defending multiple support levels below the current price, with the first one being tested at $0.134 (weekly S1 pivot). A stronger support level is located at $0.107, which is the monthly S2 pivot and a key psychological level where buyers stepped in during the November pullback. The Georgia partnership announcement has not allowed for a direct test of this level yet, but it will be the next area of focus if $0.134 is breached.
The current setup is quite akin to a descending triangle with lower highs post-December and with a flat bottom around $0.107 – implying price is in the firm grip of the sellers as long as XRP remains below the 50-day EMA resistance of $0.152. So far, each subsequent XRP bounce has been more feeble than the last indicating it will take more than a Georgia-induced rally to repair the technicals unless other Ripple-specific or crypto tailwinds are at play.
Bulls Need Daily Close Above 50-Day EMA to Shift Momentum
Buyers need to overwhelm sellers by pushing the price back into the EMA cloud, which will trap shorts and stop them out due to the widened range compression. This could create a trend reversal and will attract speculators and traders to jump back in if they are confident buyers are back in control.
If sufficient buying interest emerges and HBAR revolves back above the $0.134 weekly pivot, the $0.151 weekly resistance and $0.158 pivot will challenge the bulls. A renewed push above the $0.158 level activates the $0.169 monthly pivot as a potential upside target.
Due to the technical setup and underlying disconnect, the probable short-term scenario would be that HBAR will consolidate within $0.134-$0.146 while processing the GA news. Should there be no new drivers or the overall market does not improve, the descending triangle patter will indicate a break to the downside to $0.107 support.