GateToken Tests Critical Support After Layer 2 Launch Fails to Spark Rally
Market Pulse
- GT plunges 46% from December highs despite Layer 2 network announcement
- RSI drops to oversold territory at 44.4 as sellers dominate momentum
- $9.67 support tested repeatedly – bulls defend six-month foundation
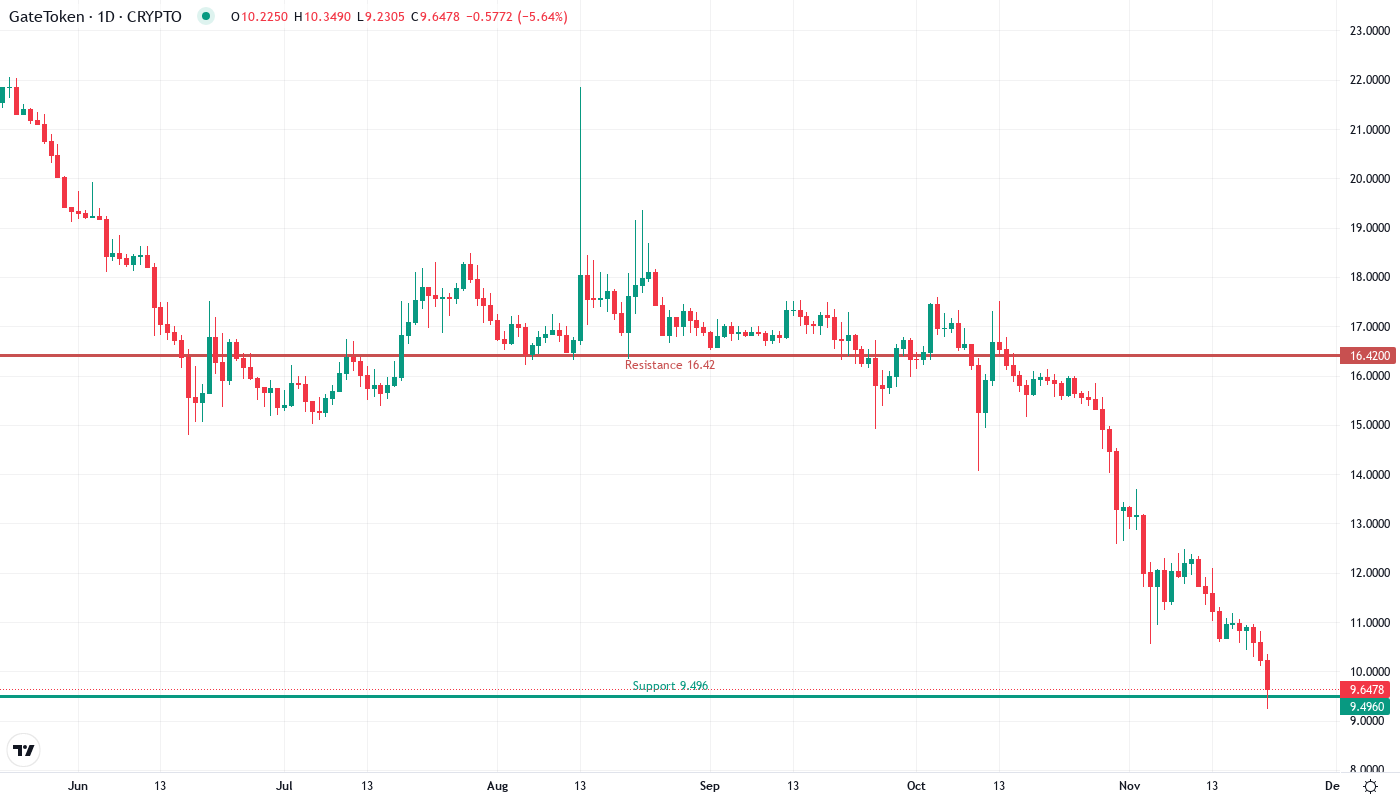
GateToken suffered a devastating 46.3% collapse from its December peak of $15.99, with the Layer 2 network launch announcement failing to arrest the downward spiral. The token now trades at $9.67, matching its levels from six months ago and erasing an entire quarter of gains. The main question for traders is: can bulls defend this critical support that has held since June, or will the Layer 2 catalyst disappointment trigger further capitulation?
| Metric | Value |
|---|---|
| Asset | GATETOKEN (GT) |
| Current Price | $9.67 |
| Weekly Performance | -13.86% |
| Monthly Performance | -39.04% |
| RSI (Relative Strength Index) | 20.6 |
| ADX (Average Directional Index) | 57.5 |
| MACD (MACD Level) | -1.08 |
| CCI (Commodity Channel Index, 20-period) | -175.41 |
RSI Drops to 44.4 – First Oversold Signal Since October Washout
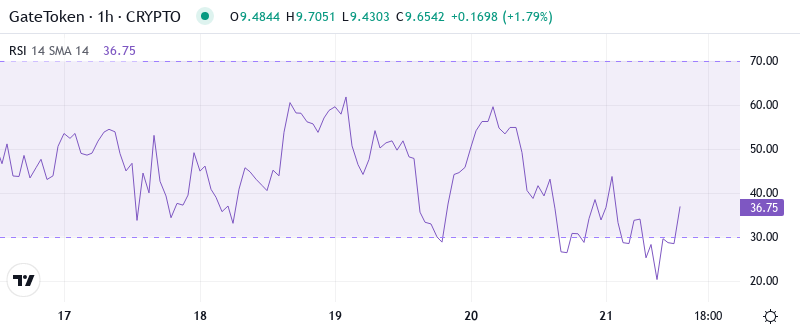
Reading the oscillator at 44.42, traders see momentum approaching oversold conditions for the first time since October’s market-wide correction. This level historically marks a zone where selling pressure exhausts itself – similar RSI configurations in September and July preceded 20-30% relief bounces within two weeks.
What’s revealing is how RSI barely budged despite the Layer 2 announcement, suggesting the market had already priced in this development or remains skeptical about GT’s exclusive gas token status translating to meaningful demand. So for swing traders, this balanced-to-weak RSI means downside momentum hasn’t reached panic levels yet, leaving room for another leg lower if support fails.
ADX at 57.5 Signals Mature Downtrend Nearing Exhaustion
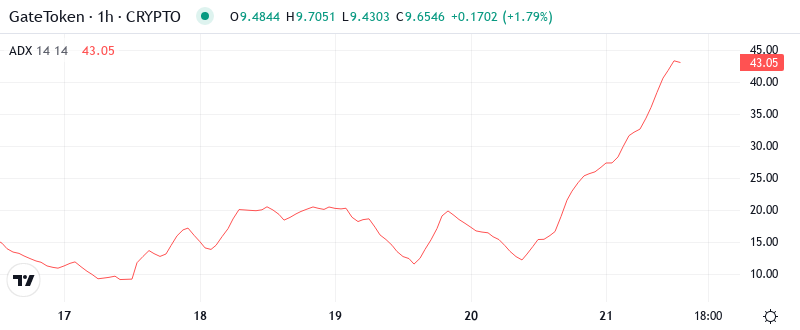
Trend strength readings show extreme conviction behind this selloff, with ADX climbing to 57.46 – its highest level since the March 2023 capitulation. Basically, when ADX reaches these extremes above 50, it often signals that the prevailing trend has run too far, too fast and reversal conditions are building.
Historically, GT’s ADX peaks above 55 marked significant turning points: March 2023 (ADX 61) preceded a 45% rally, while September’s reading of 58 marked the exact bottom before October’s recovery. Therefore, contrarian traders should prepare for potential trend exhaustion here, though catching this falling knife requires precise timing and strict risk management.
Price Trapped Below Entire EMA Cloud Since December Peak
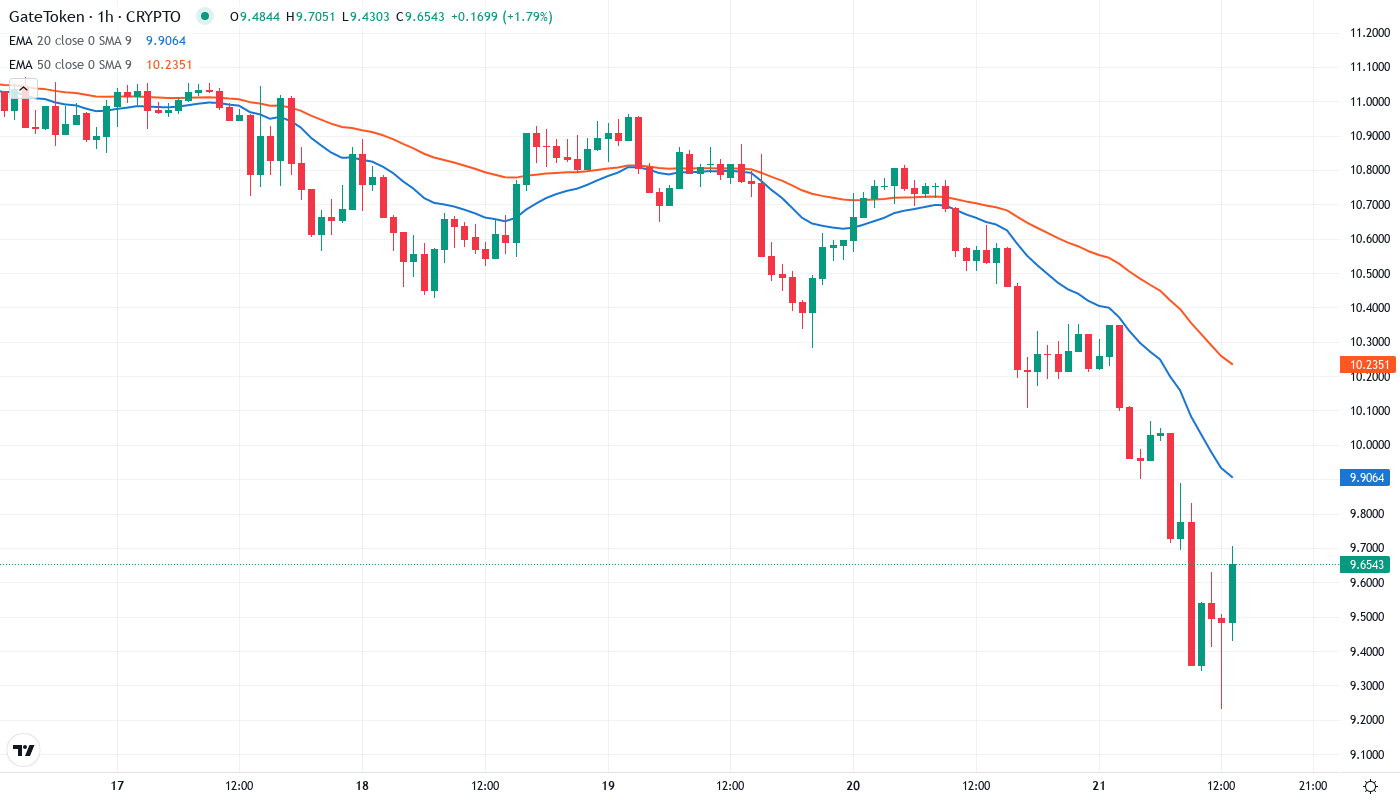
Moving average structure paints a bearish picture with GT trading below every significant EMA. The token sits beneath the 10-day ($10.75), 20-day ($11.55), 50-day ($13.31), and critically, the 200-day EMA at $16.00 – a level that hasn’t been tested since the December rejection.
Most concerning for bulls is how the 50-day EMA at $13.31 transformed from support to resistance after the Layer 2 announcement failed to generate buying pressure. This former support level now acts as a ceiling, requiring approximately 38% appreciation just to reach – highlighting the technical damage inflicted during this month-long selloff.
Support at $9.67 Holds as Final Defense – Resistance Stacks Heavy Above
Bulls defend the $9.67 level with surprising resilience, marking the sixth test of this zone since establishing it as support in June. The fact that GT bounces precisely at its six-month average suggests algorithmic buyers and long-term holders view this as a line in the sand.
Above current levels, sellers have stacked multiple resistance barriers: first at $11.41 (previous December support turned resistance), then the psychological $12 level, followed by the 50-day EMA at $13.31. Each zone represents approximately 15-20% moves, making any recovery a grinding uphill battle.
Crucially, the market structure shows that despite the Layer 2 catalyst arriving, it failed to shift the technical framework from bearish to bullish. This disconnect between fundamental development and price action signals that either the market questions the Layer 2’s competitive advantage or broader crypto weakness overwhelms positive news flow.
Bulls Need Decisive Close Above $11.41 to Shift Momentum
Should GT reclaim $11.41 with a daily close above this former support level, it would signal the first higher low since December’s peak and potentially attract momentum buyers. Bulls require this level to hold for at least two daily closes while the Layer 2 network demonstrates actual usage metrics to justify the exclusive gas token narrative.
The bearish scenario triggers if $9.67 support crumbles on volume, opening an air pocket to the next major support at $8.16 (August lows) – another 15% lower. Such a breakdown would trap Layer 2 announcement buyers and likely cascade into the $7-8 range where 2023’s accumulation zone sits.
Given the extreme ADX reading suggesting trend exhaustion and six successful defenses of $9.67, the most probable near-term outcome is a relief bounce toward $11.41 resistance, followed by continued consolidation between $9.67-$12.00 until Layer 2 adoption metrics provide fresh directional catalyst.