GateToken Plunges 32% This Month as Layer 2 Launch Fails to Stop Bleeding

Market Structure Shifts Lower
- GT drops to $10.88 from December highs of $16.13, erasing three months of gains
- Layer 2 network launch with GT as exclusive gas token hasn’t stemmed the selling pressure
- Support cluster between $9.08-$10.21 becomes critical defense zone for bulls
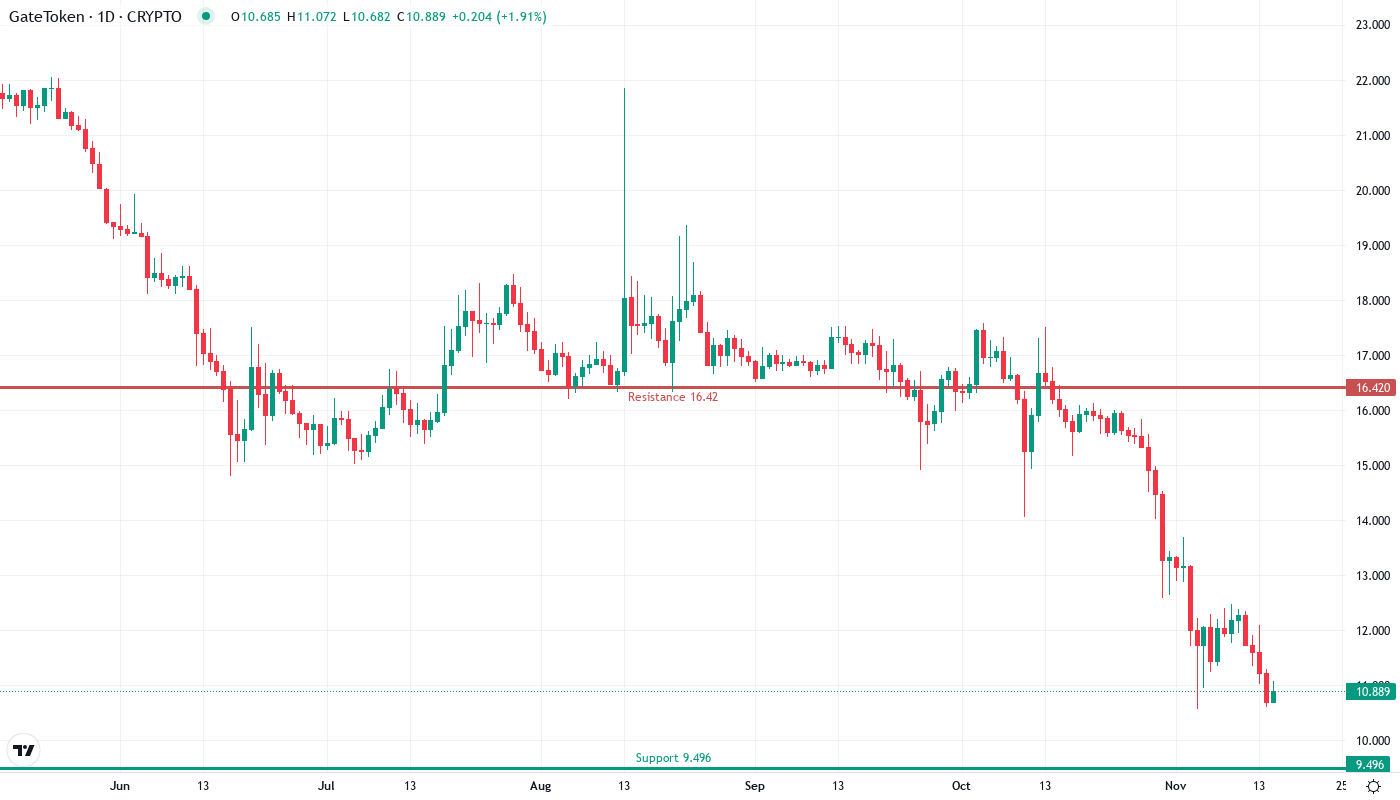
GateToken has taken the elevator down this month, shedding 32% despite launching its Layer 2 network with GT as the exclusive gas token. The token currently trades at $10.88, having collapsed from monthly highs of $16.13 to lows of $10.56 in what can only be described as a devastating drop that wiped out gains accumulated since September. The main question for traders is: can the psychological $10 level and technical support cluster hold, or will sellers push through to test August’s lows near $8?
| Metric | Value |
|---|---|
| Asset | GATETOKEN (GT) |
| Current Price | $10.88 |
| Weekly Performance | -9.58% |
| Monthly Performance | -32.07% |
| RSI (Relative Strength Index) | 26.4 |
| ADX (Average Directional Index) | 50.9 |
| MACD (MACD Level) | -1.10 |
| CCI (Commodity Channel Index, 20-period) | -104.30 |
RSI at 26.38 Signals Deep Oversold Territory – Bounce Overdue

Reading the oscillator at 26.38, traders see extreme oversold conditions not witnessed since the August washout. This level typically marks capitulation phases where weak hands have been thoroughly flushed. Interestingly enough, similar RSI readings below 30 in August and May preceded sharp relief rallies of 25-40% within two weeks.
So for swing traders, this deeply oversold RSI suggests a technical bounce is imminent, though the Layer 2 launch clearly hasn’t provided the fundamental catalyst bulls hoped for. The momentum exhaustion is real – but so is the historical tendency for GT to spring back from these extremes. Watch for RSI to reclaim 30 as the first sign sellers are losing their grip.
Trend Strength Evaporates as ADX Drops to 50.93
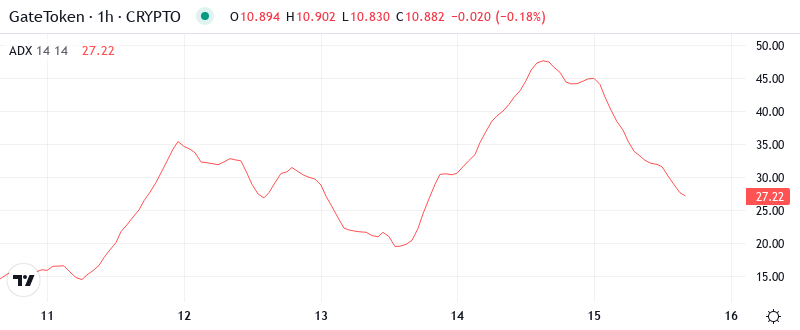
At the level of 50.93, the ADX entry indicates we’re transitioning from an extremely strong downtrend to potential exhaustion. The reading has actually declined from even higher levels, suggesting the most violent phase of selling may be ending. Basically, when ADX peaks above 50 and starts rolling over, it often coincides with temporary bottoms.
Moving forward, this ADX configuration favors range traders over trend followers. The market is shifting from directional conviction to a more balanced state where bounces and retests become the norm. Therefore, traders should adjust strategies from chasing the trend to playing the range between $9-$13 until ADX drops below 25 to signal true consolidation.
20-Day EMA at $12.45 Caps Recovery Attempts
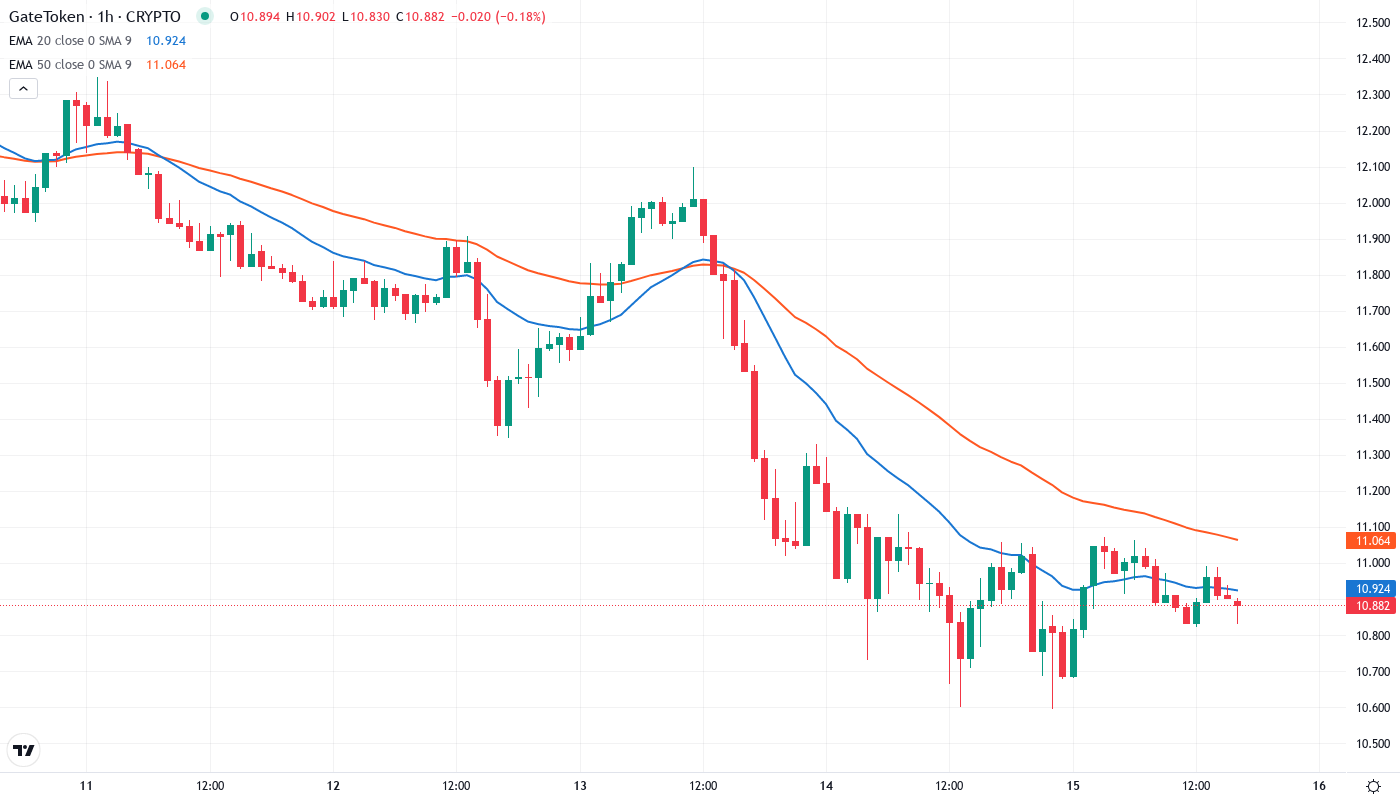
Price action tells a clear story through the EMA structure. GT sits deeply below all major moving averages, with the 10-day EMA at $11.62 providing immediate resistance, followed by the 20-day at $12.45 and the 50-day commanding presence at $14.07. The entire EMA ribbon has rolled over bearishly, creating a descending ceiling that bulls must eventually reclaim.
What’s particularly revealing is how the 50-day EMA transformed from support during October-November to firm resistance after the December breakdown. This level at $14.07 now represents the line in the sand – any sustained trade above it would signal a genuine trend reversal rather than just an oversold bounce. The Layer 2 catalyst needs to attract actual usage and demand to push price through this technical barrier.
Support Stacks Between $9.08 and $10.21 While Resistance Looms Heavy
Sellers have established a formidable resistance zone stretching from the 10-day EMA at $11.62 up through the psychological $12 level and into the 20-day EMA at $12.45. This cluster rejected the one relief attempt since the collapse began, confirming bears remain in control despite the Layer 2 launch generating initial excitement.
Bulls are making their stand at a multi-layered support zone between $9.08 (August lows) and $10.21 (recent bounce level). The psychological $10 mark sits right in the middle of this defensive perimeter, making it a natural magnet for any further downside probes. Volume has notably increased on bounces from this zone, suggesting accumulation is occurring even as the Layer 2 utility story develops.
This market structure resembles a classic washout pattern where news-driven optimism (Layer 2 launch) collided with technical distribution. The wide gap between current price and the 50-day EMA at $14.07 leaves plenty of room for recovery rallies, but resistance levels are stacked like dominoes overhead. Until GT reclaims and holds above $12.45, the intermediate trend remains firmly bearish.
Bulls Need Sustained Close Above $12.45 to Shift Momentum
Should price reclaim the 20-day EMA at $12.45 with conviction, the technical picture brightens considerably. Bulls would then target the gap fill back to $14.07, especially if Layer 2 adoption metrics start showing real traction. A daily close above $12.45 would trap late shorts and potentially trigger a squeeze toward the 50-day EMA.
The bearish scenario triggers if GT loses the $9.08 support on volume. Such a breakdown would likely flush positions down to the next major support near $8, essentially giving back all gains since August. This would indicate the Layer 2 launch has failed to generate sufficient demand to offset the broader market weakness and GT-specific distribution.
Given the deeply oversold conditions and historical bounce patterns, the most likely near-term path is a relief rally back to $11.60-$12.45 resistance, followed by consolidation between $10-$12.50 as the market digests the Layer 2 implications. Real trending moves require either a breakdown below $9 or sustained reclaim above $12.45.