GateToken Plunges 30% as Layer 2 Launch Fails to Stem Selling Pressure
Market Structure Shifts Lower
- The crash of GT has been so intense that it has not only broken all support levels but also wiped out the profits of the last six months in a terrible selloff.
- Even though GT is the exclusive gas token, the layer 2 network launch doesn’t relieve as much off of the technical damage. Instead, it just keeps on piling up.
- With a spike of 46.8, ADX unveils the strength of the sellers who push it through.
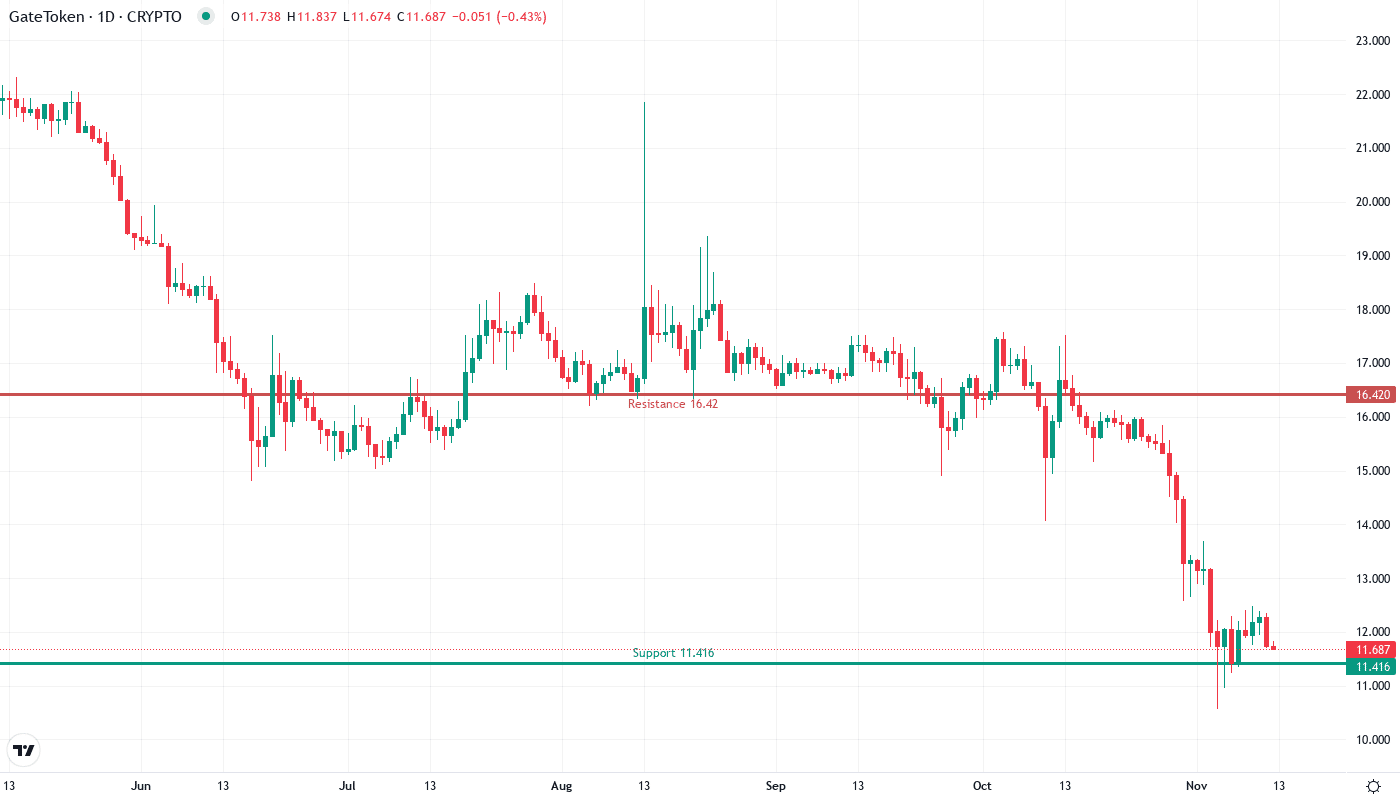
GateToken has experienced a dramatic decline of 29.94% in the last month, with the drop speeding up even more after Gate’s announcement of the launch of its Layer 2 network which positions GM as the exclusive gas token. The current price of cryptocurrency is $11.69, which is $5 lower than its monthly high of $16.78, and the price continues to decline without interruption, having lost 46% since the six-month peak. The trading community’s main question: can the Layer 2 utility narrative furnish any ground for the price, or the technical deterioration will override fundamental developments?
| Metric | Value |
|---|---|
| Asset | GATETOKEN (GT) |
| Current Price | $11.69 |
| Weekly Performance | -0.39% |
| Monthly Performance | -29.94% |
| RSI (Relative Strength Index) | 29.0 |
| ADX (Average Directional Index) | 46.8 |
| MACD (MACD Level) | -1.03 |
| CCI (Commodity Channel Index, 20-period) | -75.16 |
RSI Signals Oversold Bounce Potential
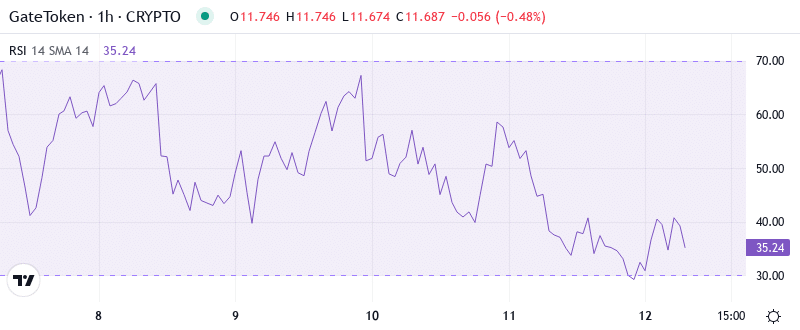
The daily timeframe of the RSI indicator has dramatically decreased to 29.67. It is very much in the oversold zone, where many typical disciplinary conditions can be found. This marking would be the lowest oversold state GT achieved for the last few months. It is, therefore, the immediate selling pressure that may be soon looking for a breather. RSI presents similar settings under 30 that in previous periods have incurred bull runs of 15-25%, although the basic direction was still negative.
The situation is like walking on a tightrope above a pitch-black abyss where traders are walking the line between making quick profits and risking their capital amid panic selling in the market due to overbought conditions. Besides, the negative price bars upon the oversold pivots have forced the indicator to show a reversal signal. The long-term investors also partook in the negative price period, thus their involvement ranged from wide buyers overhead to fewer sellers focusing on accumulating.
ADX Confirms Powerful Downtrend
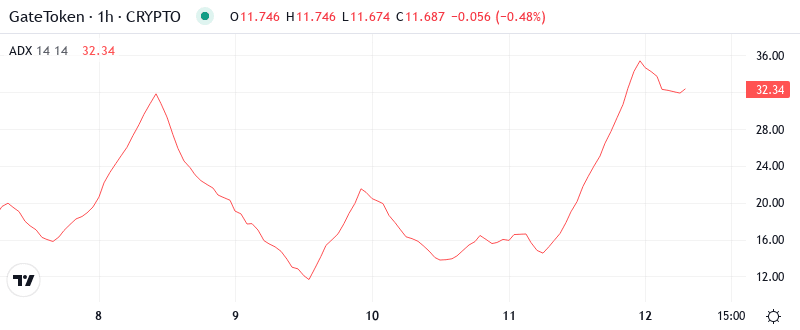
The ADX reading at 46.84, tells us about an exceptionally trending environment, with the sellers who are still holding the market structure tightly.– This high ADX, indicates that the ongoing move is backed with real strength rather than it is a temporary shakeout. In a nutshell, the ADX being above 40 means that the trend-following should be used instead of the mean-reversion methods.
From the earlier transition to the consolidation phase, the market has now moved into a distinctly trending downward phase. Accordingly, day traders should revise their approaches to prefer going short on the rallies instead of attempting to catch the knives falling. A clear technical breakdown couldn’t even be halted by the Layer 2 network announcement which indicates selling pressure prevailing over even positive fundamentals in this case.
EMA Structure Confirms Bearish Control
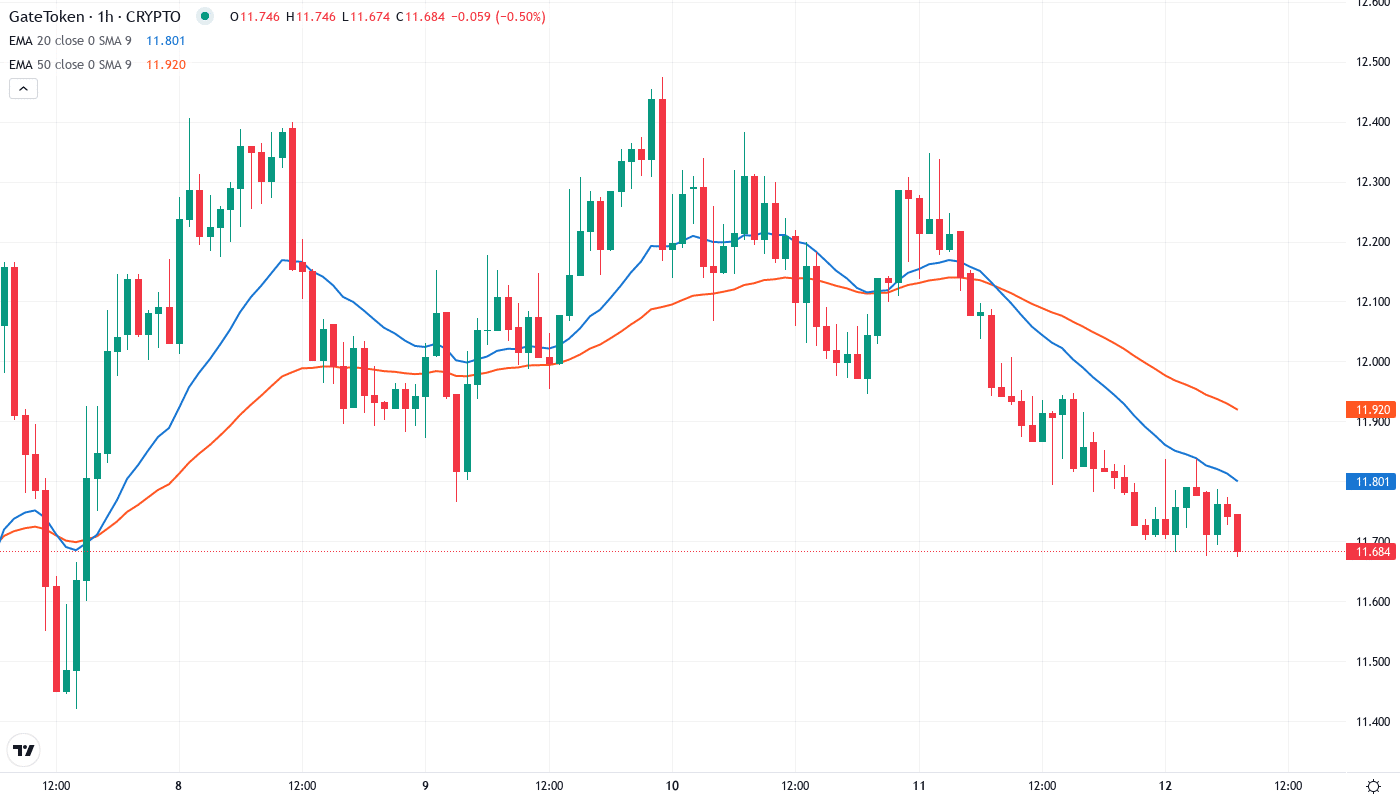
The price action demonstrated by EMA ribbons suggests that the situation for bulls is quite bleak. Currently, GT is selling for $11.69, which is very low compared to the 10-day ($12.20), 20-day ($12.99), and most importantly, the 50-day EMA which highlights a level of resistance at $14.47. The 100-day EMA at $15.59 and the 200-day EMA have also turned downwards, and the golden cross from the previous year is now probably going to be replaced by a death cross.
The 50-day EMA switched from dynamic support to resistance when the trend broke down this month rejecting several recovery attempts. The level of $14.47 is the threshold for any bullish reversal and it is the one that will have to be crossed and sustained above before the price can turn to the upper trend. The tight EMA setup in the range of $12-16 creates a strong resistance area that will need huge volumes to break.
Critical Support and Resistance Zones
Right now, the most resistant areas are the $12.20-$13.00 zone where the 10-day and 20-day EMAs are together with the psychological $12 level. This is a sell-off zone that the price failed to break out of yesterday on the basis of the increased volume, thus confirming that the sellers are still keeping the same levels. On the contrary, the $14.47 area, which is the position of the 50-day EMA, is the next big barrier for any turnaround.
The breakdown below the monthly pivot at $13.37 seems not to support much, with the next significant level being the monthly S1 pivot at $11.42, which is the closest that it can get. A monthly low at $10.56 represents the last support before the psychological levels at $10 become active. There is, in fact, an air pocket in the weekly chart below current prices as per the no structure shown until the $9 zone, which indicates that if $10.56 gives way, then the air pocket comes into play.
Selling grip of the market structure is revealed, on the condition that price continues to remain under $12.20. Each price surge has welcomed new selling thus making a series of lower highs and lower lows, which clearly interprets the current downtrend. The Layer 2 catalyst was not able to get the required amount of buying to oppose this structure which means that technical values currently exceed the fundamental narratives.
Bulls Need Volume-Backed Reclaim Above $14.47
To reverse the negative structure, bulls are required to make the price stay above $14.47 in a strong way with substantial volume. This would mean reclaiming the 50-day EMA and it could lead to the covering of short positions towards $16.30. Besides, the launch of Layer 2 ecosystem can serve as a primary driver, but initially, the currency must technically show its strength elevating the price without the narrative-driven.
If GT gets to lose the $10.56 monthly low on volume, the bearish scenario would be more severe – this would largely open the way toward the single digits with the $9.08 weekly S2 pivot as the next target. A decline like this would be very much able to trap the new buyers who thought that the Layer 2 launching had marked the bottom, thus possibly leading to a selling of assets towards $8 or even lower due to the capitulation.
The current trend prevailing the layer 2 narrative and the RSI being deeply oversold on different timeframes, the most probable short-term path is GT trying to make a relief bounce towards the resistance level of $12.50-13.00 before the sellers control the market again for another stage down to $10.
