GateToken Darts Through $10 as Layer 2 Launch Fuels 11% Weekly Recovery

Market Pulse
- GT rebounds 11% from weekly lows after Gate unveils Layer 2 network with GT as exclusive gas token
- Momentum indicators flash neutral at 46.9 RSI while ADX climbs past 37, signaling trend strength building
- Price must reclaim $11.32 resistance or risk revisiting $9.20 support that held three times this week
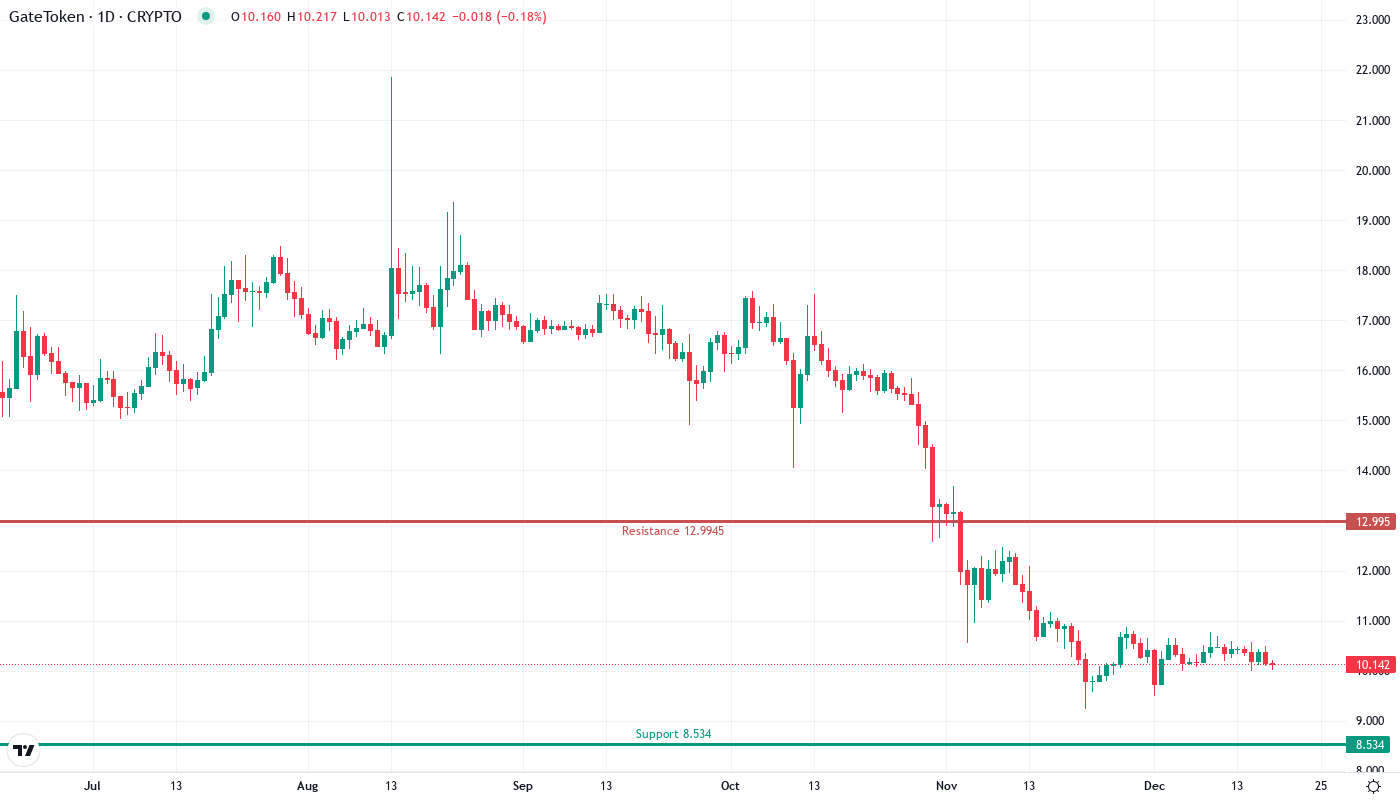
GateToken staged a convincing recovery this week, climbing 11% from its $9.23 low to reclaim the psychological $10 level after Gate announced its Layer 2 network launch. The move marks a sharp reversal from the token’s devastating 40% monthly decline, with the Layer 2 announcement providing the catalyst bulls needed to defend critical support. The main question for traders is: can this news-driven bounce evolve into a sustainable trend reversal, or will sellers emerge at overhead resistance?
| Metric | Value |
|---|---|
| Asset | GATETOKEN (GT) |
| Current Price | $10.18 |
| Weekly Performance | -2.84% |
| Monthly Performance | -6.12% |
| RSI (Relative Strength Index) | 41.8 |
| ADX (Average Directional Index) | 37.7 |
| MACD (MACD Level) | -0.21 |
| CCI (Commodity Channel Index, 20-period) | -92.15 |
Momentum Resets to Neutral Territory After Layer 2 Catalyst
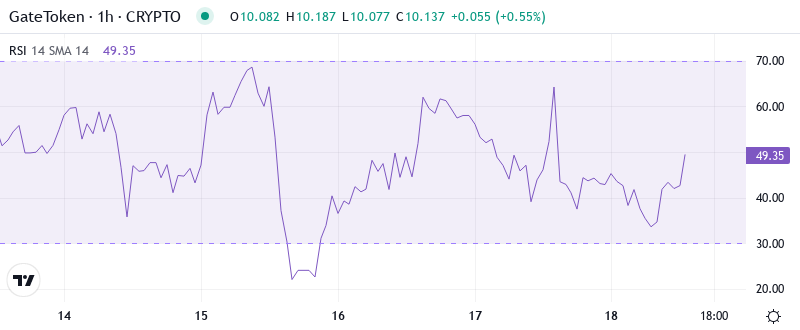
RSI sits at 46.92 on the daily timeframe, having bounced from oversold conditions below 30 just days ago. This reset from extreme pessimism to neutral ground typically signals the initial phase of a potential trend reversal, especially when accompanied by fundamental catalysts like the Layer 2 launch positioning GT as an essential infrastructure token.
What’s revealing is how RSI behaved during the announcement – it surged from 37 to current levels in just two sessions, matching the velocity seen during GT’s October rally that preceded a 35% advance. So for swing traders, this balanced RSI means there’s room for continuation higher before overbought concerns emerge, but the speed of the recovery warns against chasing without a pullback.
ADX at 37.7 Confirms Genuine Trend Strength Building
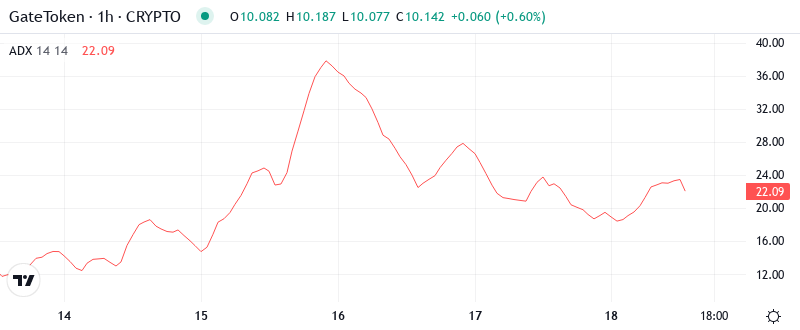
Looking at trend strength, the ADX reading of 37.72 tells us this isn’t just another dead cat bounce. Values above 25 indicate trending conditions, and readings approaching 40 suggest strong directional movement with conviction. The Layer 2 news clearly shifted market dynamics from the choppy, directionless action that dominated December’s decline.
To clarify, the ADX is indicating that we are switching from boundary conditions to a trending state – precisely what traders want to see after a major fundamental development. Therefore, day traders should suit their strategies to this change, favoring momentum entries on pullbacks rather than mean reversion trades that worked during the recent consolidation phase.
20-Day EMA at $10.38 Becomes First Test of Recovery Strength
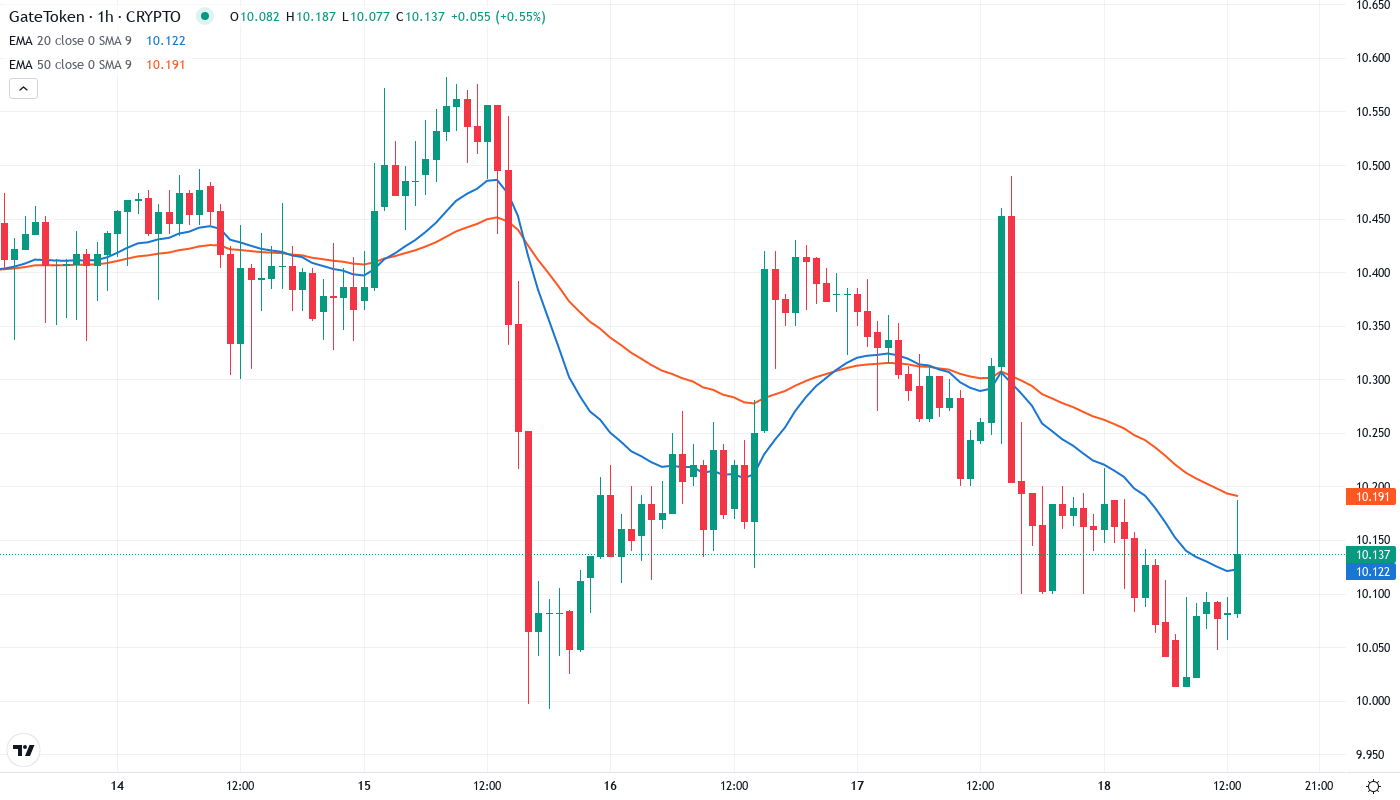
Price action reveals GT trading just below the complete EMA ribbon, with immediate resistance at the 20-day EMA ($10.38). The 50-day EMA looms higher at $11.32, having rejected price attempts twice in early January before the Layer 2 announcement changed the narrative. What’s significant is the compression between current price and these moving averages – GT needs to reclaim at least the 20-day to confirm buyers have truly returned.
More telling is the 200-day EMA positioned way up at $13.35, illustrating just how far GT fell during its recent correction. That former support area at $11.32 (the 50-day) now transforms into a red line for the bulls to hold if they manage to push price there. The Layer 2 utility case provides fundamental backing, but technical resistance remains formidable after such a steep decline.
Resistance Stacks Between $10.62 Monthly Pivot and $11.32 50-Day EMA
Above current price, sellers have stacked multiple resistance layers that coincide with both technical indicators and psychological levels.
The monthly pivot at $10.62 marks the first hurdle, closely followed by the 50-day EMA at $11.32 which capped rallies twice before the Layer 2 news hit. Bulls need volume and sustained buying pressure to clear this zone, especially since it also marks the 38.2% Fibonacci retracement of the recent decline.
Bulls defend multiple support layers below, with the weekly low at $9.23 establishing a clear line in the sand. This level held three times during testing, gaining significance with each successful defense. The psychological $9 level sits just below, offering a final safety net before the monthly pivot support at $8.53 comes into play.
This configuration resembles a compressed spring, with the Layer 2 announcement providing the fundamental catalyst for directional resolution. The market structure signals buyer’s power as long as they can keep $9.20 intact during any retracement, giving them a solid foundation to attack overhead resistance as Layer 2 adoption metrics emerge.
Bulls Need Decisive Close Above $11.32 to Confirm Layer 2 Momentum
Should price reclaim the 50-day EMA at $11.32 with conviction, bulls would target the gap toward $12.90 where the monthly R1 pivot awaits. The Layer 2 narrative provides ongoing catalysts as developers deploy applications requiring GT for gas fees, potentially sustaining buying pressure beyond typical technical bounces.
The setup fails if GT gets rejected at $10.62 and breaks back below $9.80 on volume. This would trap recent buyers who entered on Layer 2 optimism, likely triggering stops toward $9.20 support. A loss of that level would signal the news bounce has exhausted, opening downside toward $8.53.
Given the technical configuration paired with Layer 2 fundamentals, the most likely near-term path is for GT to consolidate between $9.80 and $10.62 while digesting recent gains, then attempt another leg higher as Layer 2 metrics demonstrate real utility demand for the token.