Ethereum Tests $2,800 Support as ADX Climbs Past 42 – Trend Followers Take Notice
Market Structure Shifts Higher
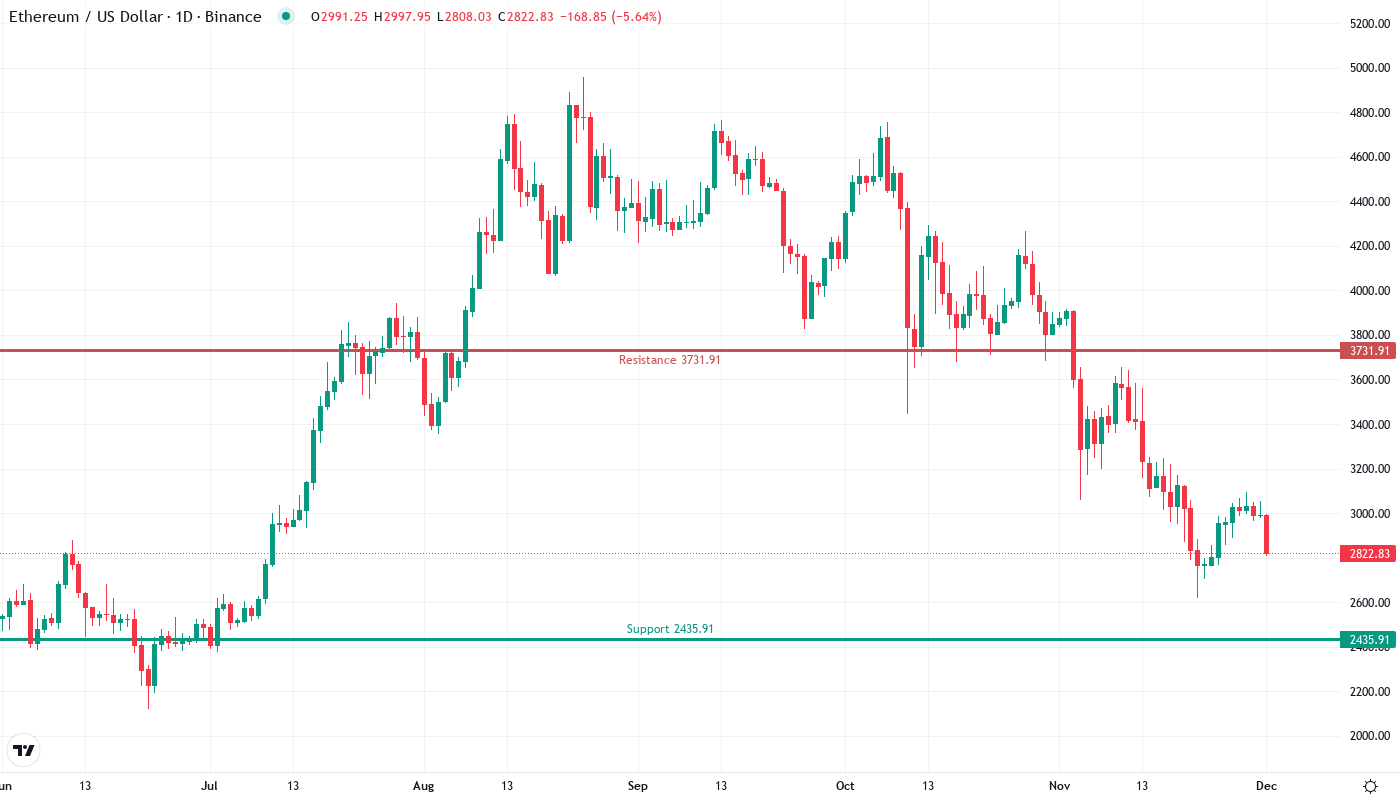
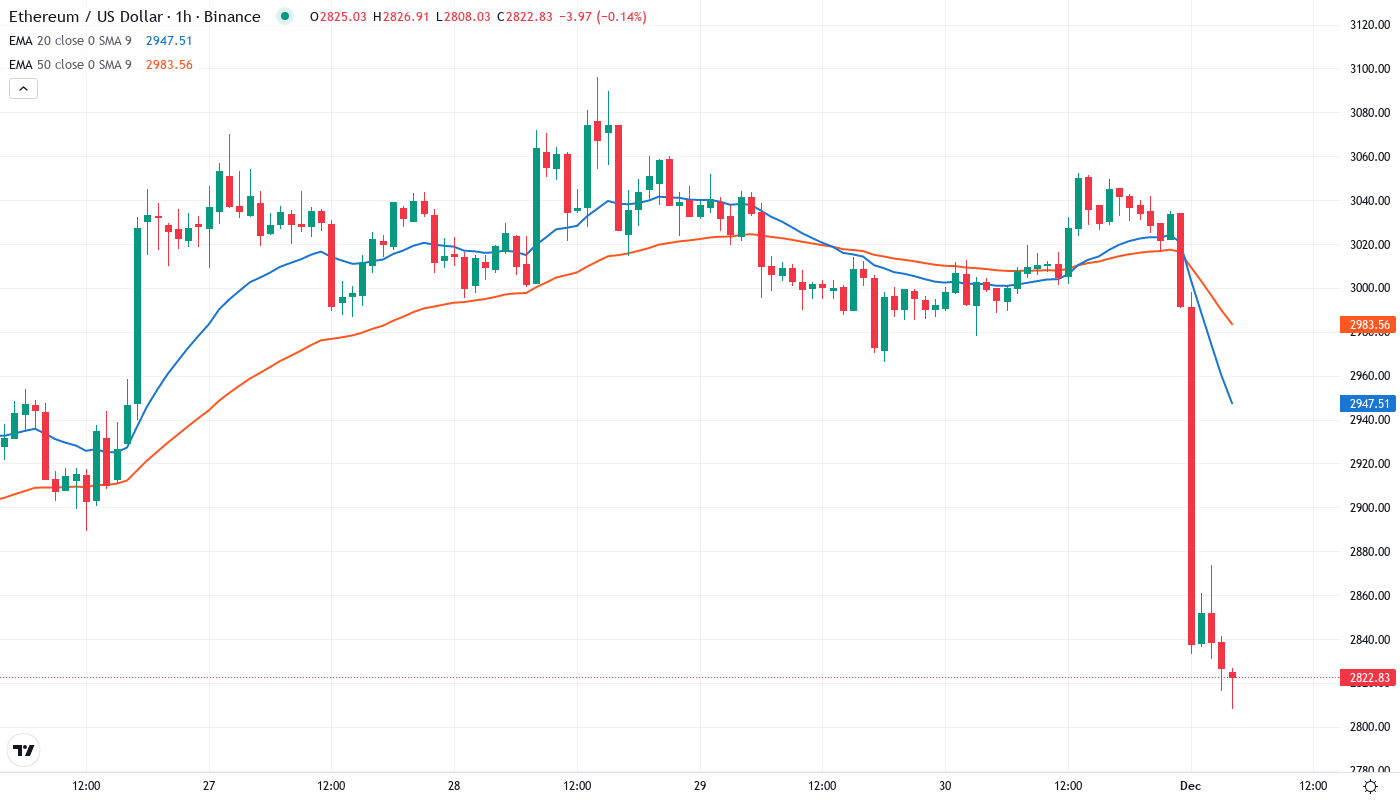
- ETH recovered from the $2,530 December low and rallied nearly 12% to around $2,850.
- Bulls have turned the previous low into a higher low and are eyeing the $2,800 level.
- A successful break and hold above $2,800 could pave the way for further upside.
ETH has successfully recovered from the low of $2,530 that was tested on December 2nd. The bulls managed to hold that low and immediately saw a 12% move to the upside, with ETH trading at nearly $2,850 at the time of writing. The bulls have also managed to turn this previous low support level into a new higher low.
The bulls are now attempting to recover a lost key level at $2,800. This is a psychological resistance/support level that has held over the past week. If the bulls are able to get above this level and use it as support, they will look to continue the push higher.
The recent price action in Ethereum may have been demoralizing for anyone who got swept up in the December euphoria, but the levels and market dynamics offer intriguing possibilities. The high around $3,550 is a key level that goes back to February 2018, when it was an inflection point along the way down from all-time highs and later an inflection point after prices were recovering from March 2020 and gearing up for the early 2021 breakout to $4,360. This makes it a significant tipping point, where it tends to be resistance after falling below it and support after climbing above it.
| Metric | Value |
|---|---|
| Asset | ETHEREUM (ETH) |
| Current Price | $2841.04 |
| Weekly Performance | 1.39% |
| Monthly Performance | -26.19% |
| RSI (Relative Strength Index) | 34.5 |
| ADX (Average Directional Index) | 42.6 |
| MACD (MACD Level) | -158.47 |
| CCI (Commodity Channel Index, 20-period) | -71.87 |
Momentum Exhaustion Shows Clear Reset From Overbought Extremes
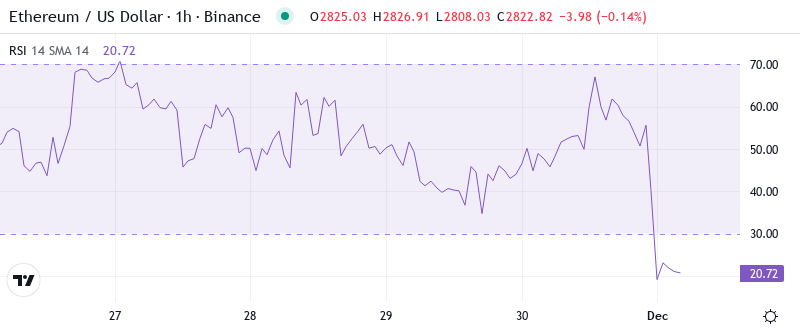
The RSI (Relative Strength Index) is at 34.47 on the daily chart. This is the first truly oversold reading since the washout in late August prior to a 40% rally. The fact that momentum got even more extended to the downside before price is interesting – it took just three weeks for the oscillator to go from over 75 to here. This is often indicative of forced selling rather than just liquidation by existing longs.
Comparable RSI setups in September and October always signified intermediate lows, especially when there were positive fundamental catalysts. For swing traders, this oversold bounce setup is further supported by the fact that several valuation models are flashing ETH undervaluation – a combination of technical and fundamental support that has resulted in multi-week recoveries historically.
ADX at 42.55 Confirms Mature Downtrend Nearing Exhaustion Phase
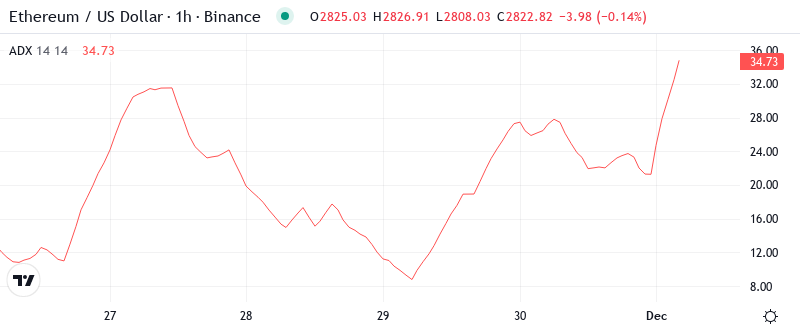
When you look at trend strength indicators, an ADX reading of 42.55 suggests that we are well into a directional move – but importantly such readings frequently signal trend exhaustion rather than trend continuation, the ADX is at a level where it suggests the bearish trend has become very mature, with sellers likely running out of bullets following the aggressive December flush.
In other words, when ADX moves above 40, it usually indicates that the prevailing trend is too strong and about to change. So, traders who go against the trend must be alert to trend exhaustion signals while those who follow the trend must understand that there is probably no more easy money in the current downtrend. The increase in decentralized exchange volumes we highlighted in last week’s publications may be the right reason to provide the final solution for the trend.
20-Day EMA at $3,064 Transforms From Support to Key Resistance Barrier
Looking left, the $2,850-$2,900 zone forced a swing high in early December and late January. This resistance level flipped in late December then again turned a support level since from February. Now, this area awaits its next test although any failed daily close above hasn’t retested the level the next day.
In the prior week, bulls made three tries to recapture 20-day EMA, but every time it was turned back, showing greater volumes – traditional distribution action. The block where earlier support $3,064 was placed, is now changing into a red one. Bulls need to get back over it on a daily basis to provide a clear sign of any change in the trend. The resistance will fare as well until then. Most likely, goes downhill, despite being oversold.
Resistance Stacks Between $3,176 December Low and $3,290 100-Day Average
Resistance from $3,176 (a previous support level from December that failed to hold) extends through the monthly pivot at $3,290. This resistance in particular is a convergence of technical resistance/support, the 100-day moving average, as well as the psychological level of $3,200.
The bulls are defending many layers of support rather impressively, first of which is the important $2,530 level, which was the December washed-out low. Beyond that, the monthly S1 pivot at $2,435 offers secondary support, with the annual low of around $1,880 the ultimate bear target if all these levels give way.
Overall, the market structure seems to warrant cautious optimism as long as buyers can maintain the price above $2,800 on any retracement. ETH indiscriminately bounced 12% from the December low despite the Yearn phishing FUD and risk-off environment, so the likelihood of accumulation is high. However, bulls will need sustained buying pressure to flip the intermediate trend.
Recovery Requires Daily Close Above $3,064 to Shift Momentum
In order to confirm that the oversold bounce has more legs, bulls really need to see a solid daily close above the 20-day EMA at $3,064. This would open up the $3,290 resistance cluster as the next target. Going forward, the expanding DEX ecosystem and L1 optimization upgrades could be potential continued catalysts for healthy demand.
If you look at a bearish scenario, it would play out once ETH loses the support at $2,800 and with strong volume, especially if it occurs amid negative regulatory news or the overall weakness in the cryptocurrency market. In this case, the price would trigger stops of the recent dip orders, which would later lead the price to the $2,435 monthly pivot, a typical level of such stops. If it continues to breach this level and head lower, the market would reach $2,200 eventually, as the market “feels” like the next logical support region.
With the Relative strength index (RSI) getting severely oversold, the Average Directional Index (ADX) hitting exhaustion points above 40, and the multiple fundamental tailwinds via on-chain activity growth, the most likely near-term path is Ethereum consolidates somewhere between $2,800 and $3,064 before making another attempt at a second leg higher. The tell will obviously be if bulls can defend higher lows on any retest of support.