Ethereum Darts Through $2,930 as Institutional Money Tests December’s Beaten Path

Market Structure Shifts Higher
- JPMorgan launched an equity-based blockchain product, raising over $100 million.
- Ethereum rallied 37% vs Bitcoin’s 28%, testing critical support at $2,800 and aiming for $3,000.
- RSI, ADX, and EMA indicators highlight momentum exhaustion, trend acceleration, and resistance clusters.
JPMorgan has launched an actively managed equity-based product on the blockchain, and it’s raised more than $100 million, Business Insider reported this week. The product, running on the Liink…
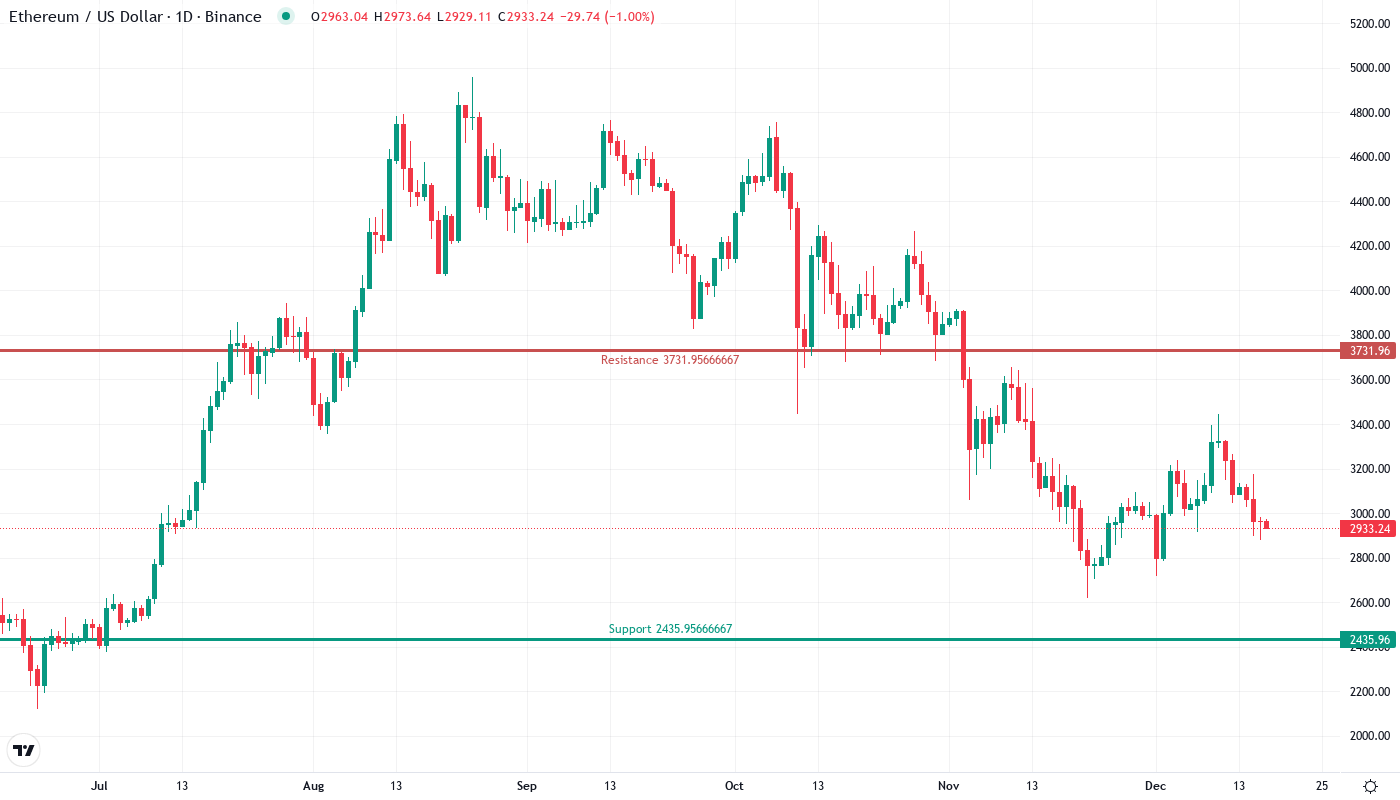
After a brutal downtrend slapped off 36% of its value, ethereum managed to outpace bitcoin on the road to recovery, rallying 37% versus the leader’s 28%. With bears determined to prevent the smart contract giant from filling its CME gap and reclaiming the psychological $3K level, bids must keep a close posture above the psychologically pivotal $2,800 mark while bears attempt to exploit sentiment to take control of the altcoin’s first red weekly close in nine weeks.
| Metric | Value |
|---|---|
| Asset | ETHEREUM (ETH) |
| Current Price | $2931.79 |
| Weekly Performance | -11.66% |
| Monthly Performance | -5.31% |
| RSI (Relative Strength Index) | 41.1 |
| ADX (Average Directional Index) | 28.7 |
| MACD (MACD Level) | -44.83 |
| CCI (Commodity Channel Index, 20-period) | -92.76 |
Momentum Exhaustion Signals Capitulation Phase Complete
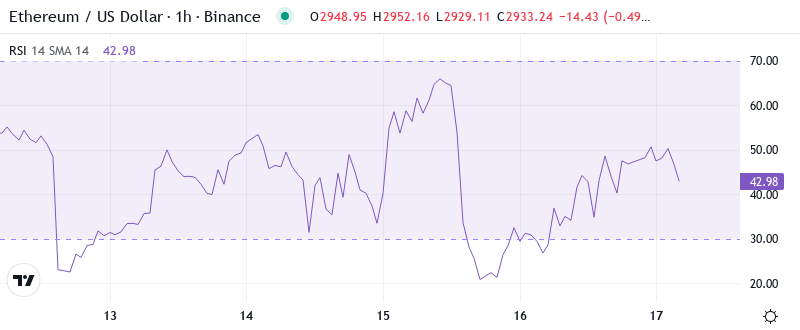
The Relative Strength Index is at 41.14 on a daily timeframe which is the first legitimate oversold reading since the October washout low that proceeded a 45% surge. Last month’s drop from a 50.23 reading highlights the apparent exhaustion in momentum indicative of everything technicians would hope to see following an extended advance. Equivalent RSI set-ups in September and early November both pinpointed important local lows, with the latter pushing price to new all-time highs.
What is interesting is the behavior of the RSI during the $105 million liquidation cascade from last week. While the price action forced out the overleveraged longs in the market the oscillator barely wiggled below 40 – indicating that spot sellers aren’t heaping on with nearly the same conviction as their derivatives trading counterparts. For swing traders, this balanced momentum picture means the former are beginning to offer up attractive zones of accumulation, especially if price can maintain the key psychological anchor of $2,900 structure of the JPMorgan tokenized fund.
ADX at 28.69 Signals Trend Acceleration From December Chop
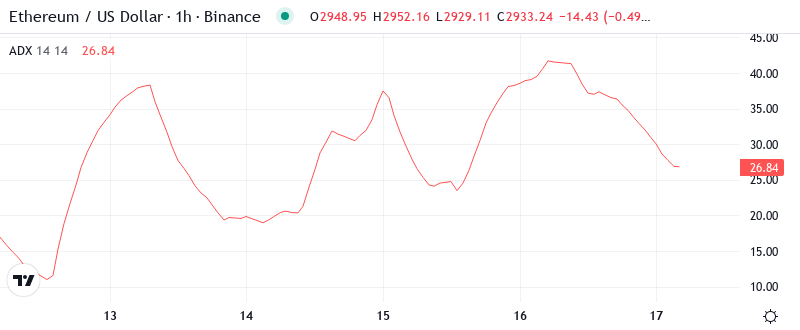
When considering trend strength, the ADX reading of 28.69 indicates a firm departure from the horizontal churning seen throughout most of December. The indicator increased from the low-20s right as the forced liquidation event occurred, indicating that we have shifted from a low-volatility, range-bound environment to a trending market. In short, the market made up its mind after oscillating in a $3,200–$3,400 range for several weeks.
In simpler terms, the average directional index (ADX) is a trend strength indicator that is telling traders to change their style from buying the dip and selling the rip to one of selling the dip and buying the rip as the previous trend has now resumed. The reading above 25 but below 40 also implies this is the optimal range as the trend is strong enough to keep you in the trade and not get whipsawed, but not too strong to be near a reversal.
20-Day EMA Flips to Resistance After Supporting Price Since November
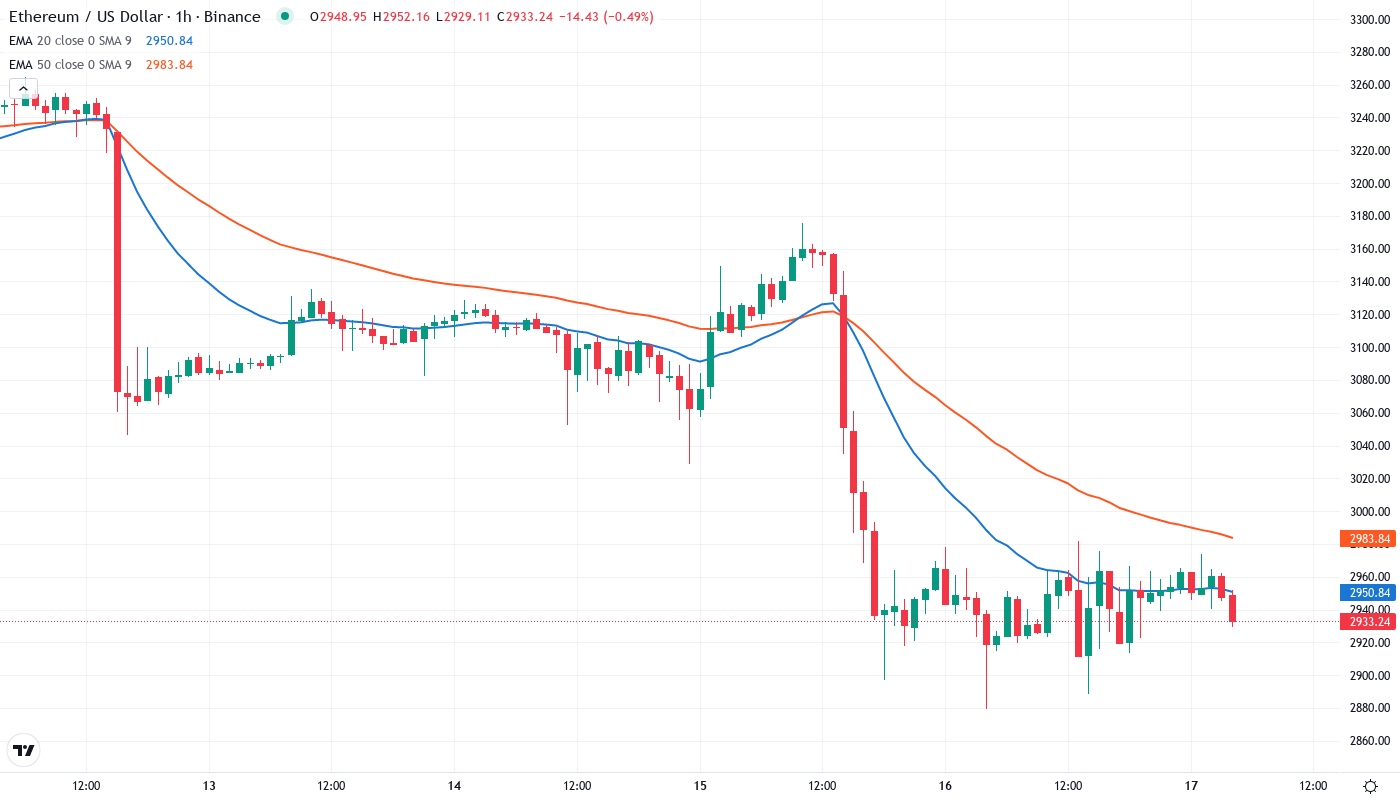
The EMA ribbons themselves provide various supports on the downside, with the 50-day and 100-day EMAs at $3.250 and $3,085 respectively. The ribbon does not paint a particularly buoyant picture though, and several layers of EMAs will now form overhead resistance if ETH attempts to rally back up.
The 20-day EMA at $3,074, having been a solid floor throughout November, has now become the key resistance level to scale. This level blocked progress on two occasions last week before the sell-off intensified and forced out right stops above it. The old floor is now the line in the sand for the bulls – a daily finish above $3,074 and I would expect to see the selling dry up as rotations from retail investors to smart money companies including JPMorgan occur.
Resistance Stacks Heavy Between $3,074 and $3,250
There are several resistance levels above the current price. The 20-day EMA at $3,074 and the 30-day EMA at $3,120 are the first resistance levels, where the failed breakout of December left the buyers trapped. Then, the 50-day EMA at $3,250 and the 20-week EMA at $3,345 are the next levels before reaching the monthly pivot at $3,420.
Bulls protect various support levels, commencing at the psychological $2,900 handle, and remained intact in last week’s rinse. Even stronger support is seen at $2,854, where the 100-day EMA stands guard, and then the weekly pivot at $2,435. Also, the exact tap of $2,620 (monthly low) on the liquidation thesis screams that buyers start to look attractive at notable technical areas.
Most importantly, the market structure clearly shows that the latest round of price discovery occurred in a higher pricing band, another bullish sign of sustainable price appreciation. We also reiterate that bull markets become overextended to the upside when price discoveries occur in low bands. Our reads for all U.S. futures contract owners of U.S. futures were updated upon the September expiration settlement.
Bulls Need Daily Close Above $3,074 to Confirm Recovery
If price can get back above the 20-day EMA at $3,074 and further institutional adoption like the launch of JPMorgan’s privacy-focused ‘JPM Coin’ ignites a more sustained trend, we should then have the wind at our backs for a more measured move to our next target at the 50-day EMA of $3,250.
The setup will be invalidated if Ether price breaks below the $2,850 support, which is in confluence with the 100-day exponential moving average (EMA). If that happens, another round of long liquidations is likely to occur, driving the price toward $2,600 and possibly $2,435 (weekly pivot low). This will also lead to sellers from institutional clients being trapped in losing positions.
Based on the technical setup and JPMorgan’s well-timed re-entry, the most likely short-term trajectory has ETH consolidating between $2,900 and $3,074 and retesting a breakout level following last week’s volatility before making another move upward as institutional FOMO takes over.