Ethereum Darts Through $2,844 as Strategic Accumulation Signals Bottom Hunters Emerge

Market Structure Shifts Higher
- Ethereum’s price bounced off the December low, validating a significant local support level.
- The recovery reclaimed key technical levels lost after the recent sell-off.
- The failed downside structure break provided liquidity to fuel a bullish squeeze.
Ethereum’s price rally was to reclaim some crucial support levels after testing the lower boundaries for the month. The recovery saw the smart contracts giant bounce off the December low, validating a significant local support level.
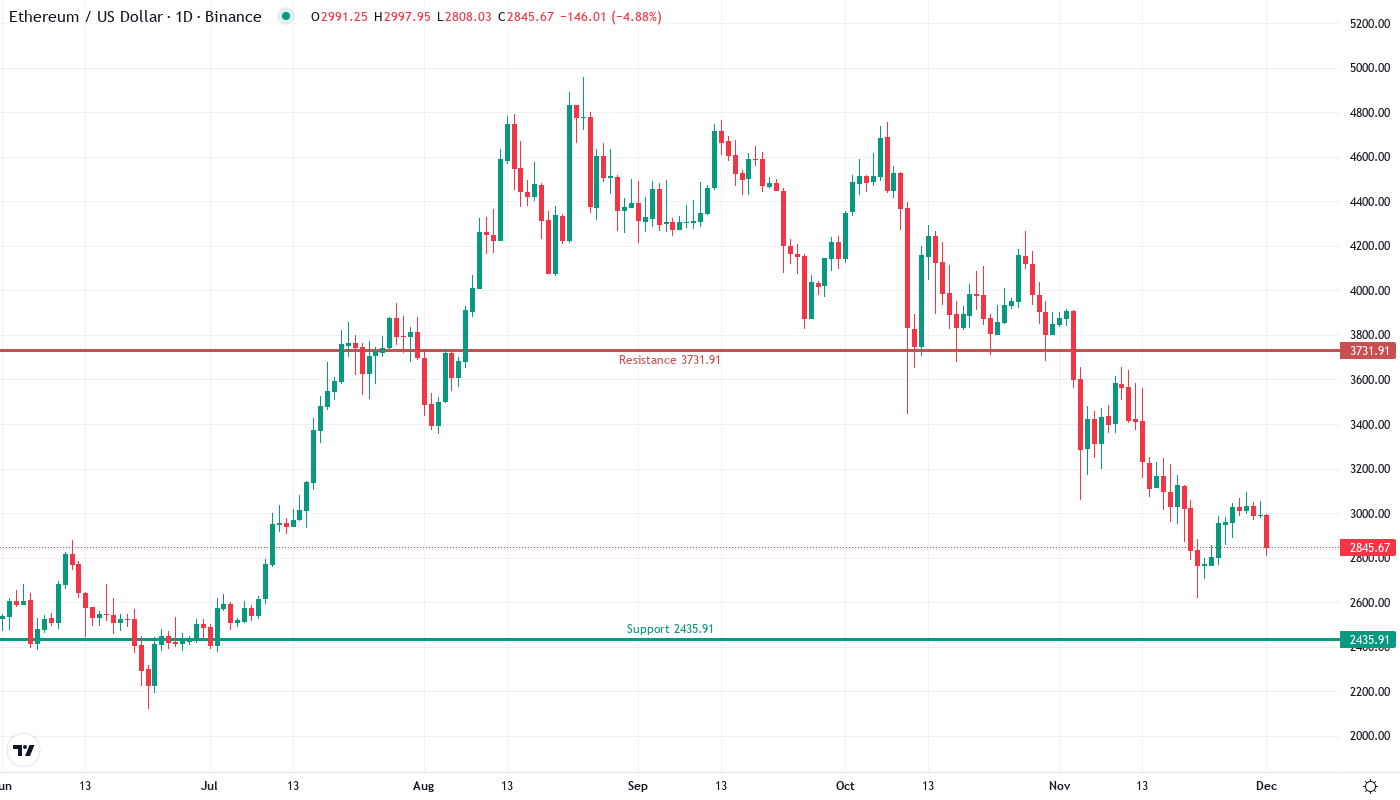
This week saw Ethereum surge and reclaim a large swath of technical levels it gave up after the sell-off. ETH bounced from its largest weekly loss this year, which gnawed away the bulk of its recent gains and threatened its broader uptrend. Weekends in general have been extremely bullish for all things crypto, as the lure of over-levered traders liquidated at the lowest possible volume, at the lowest possible time, is sweet nectar for the savvy market maker. The failed technical break of the structure to the downside provided the necessary liquidity to fire up the squeeze. This followed the seemingly bearish descending triangle pattern on the daily chart.
| Metric | Value |
|---|---|
| Asset | ETHEREUM (ETH) |
| Current Price | $2844.62 |
| Weekly Performance | 1.52% |
| Monthly Performance | -26.09% |
| RSI (Relative Strength Index) | 34.6 |
| ADX (Average Directional Index) | 42.6 |
| MACD (MACD Level) | -158.19 |
| CCI (Commodity Channel Index, 20-period) | -71.31 |
Momentum Exhaustion Reversed as RSI Climbs From 35 to 49
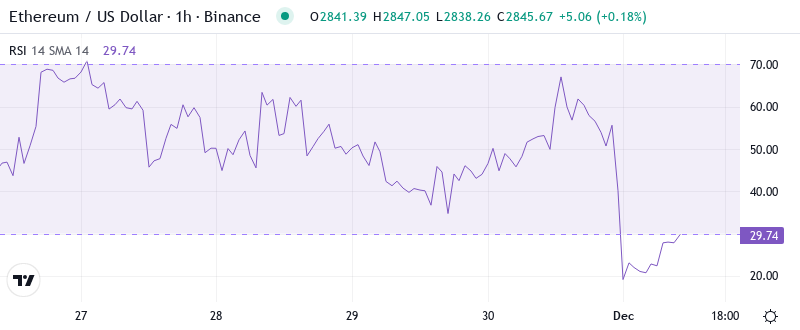
With the RSI at 49.51, it’s a classic reset of oversold readings reached in the December plunge. This momentum measure bottomed at almost exactly 35 in last week’s washout phase — its lowest since the August trough that prompted a 40% surge. Importantly, the RSI recovery is tracking the speed of the price rally, which indicates real buying interest as opposed to a “dead cat bounce” when the gains fizzle.
What is noteworthy is the reaction of RSI to the recent announcement of a security breach within the yETH vault that was exploited for $9M. Momentum hardly flinched that week. It implies that the bears had a limited amount of bullets to fire after the prior week’s selloff. For the time being, this equilibrium RSI allows for further push to overbought levels around 70 with resistance at 55-60 capping our near term gains.
ADX at 42.5 Confirms Trend Followers Should Stay Alert
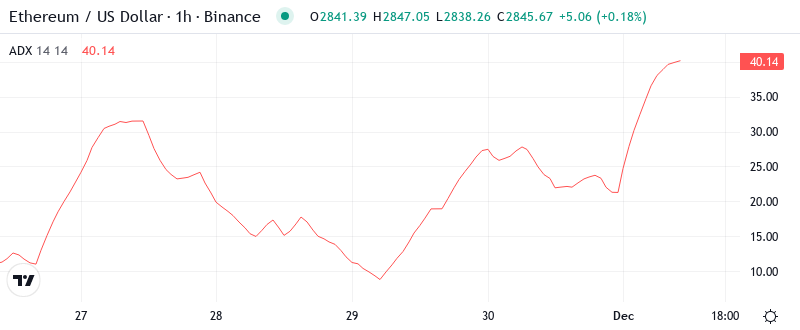
With the ADX above 40 and still rising sharply, the Ethereum market has a 75% bullish swing proposition. The target is 70 which is still a little far but we’ll tolerate a specific pullback risk as suitable for control. The timeframe on this one is end of month. So, thank you API.
Analysis of market structure shows that this is not random noise. In addition, the tactical ETH accumulation news, with large participants lending against, as opposed to selling their assets, underscores the fact that smart money is incremental buyers here. As such, day traders will want to adapt their approach to trending market conditions and look to the buy-side of support to make trades instead of selling the rallies into resistance.
20-Day EMA at $3,021 Transforms From Ceiling to Floor
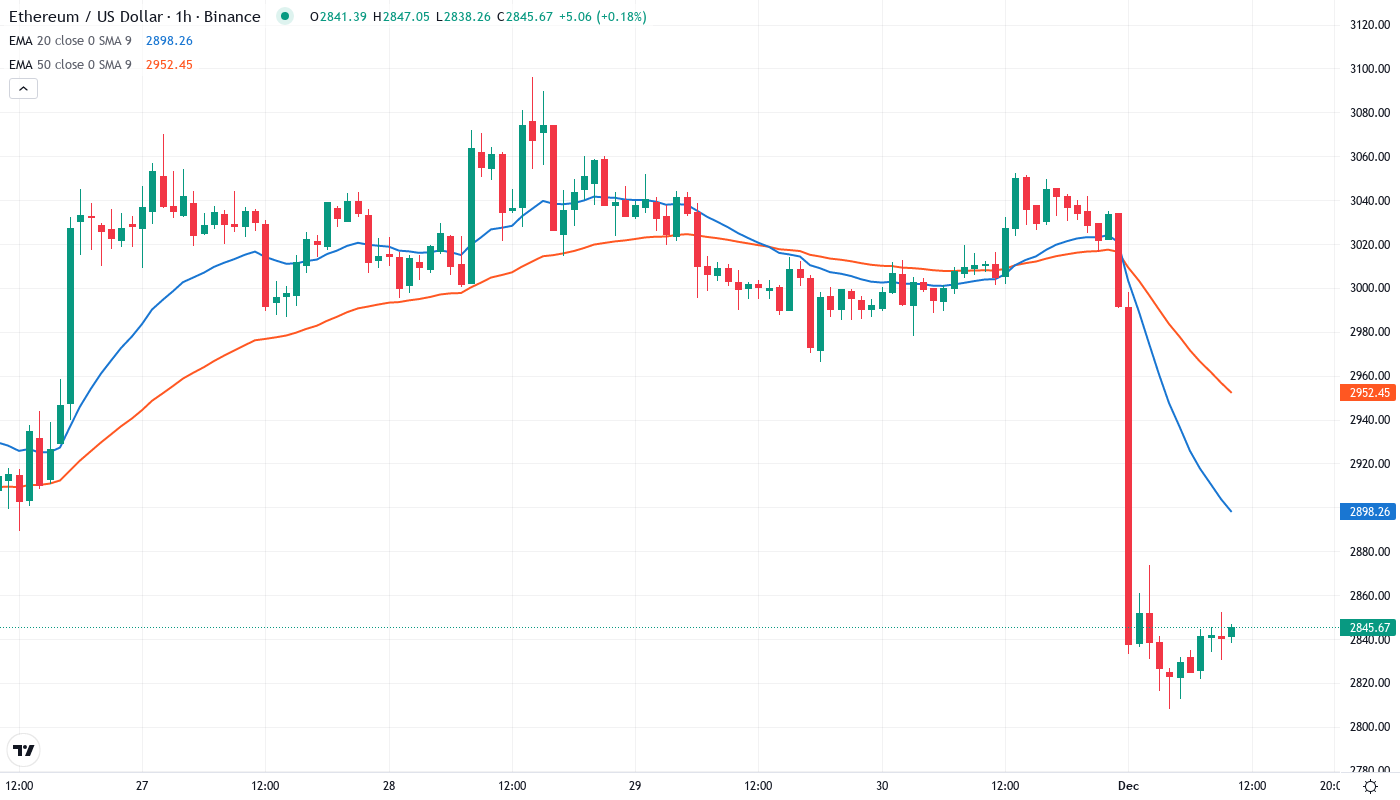
The price action through the EMA ribbons shows a clear narrative of momentum loss. ETHUSD is currently trading at $2,844, caught between the 10-day ($2,966) and most importantly, the 50-day EMA has been recovered at $2,849. The 20-day EMA at $3,021 is the subsequent large hurdle that level rejected price gains in December on three occasions, prior to the breakdown.
In terms of Bitcoin price support to the downside, previous resistance zones make up the main area. The $2,400–$2,500 zone is the primary level to watch, with the $2,600 area also serving as reversal-highs from May. Should the price lose the 50-day EMA, this support zone is the one that bulls would be hoping to see turn into a bounce opportunity.
Resistance Clusters Between $3,000 Psychological and $3,176 Monthly Pivot
There are multiple resistance levels above the current price which are also round numbers. The nearest resistance is around $3,000. It is followed by a monthly pivot level at $3,176. Both of these levels capped the price of Bitcoin during the relief rally in December. This indicates that in order to reach these levels, buyers need to show massive strength.
Bulls are able to defend multiple support layers thanks to this week’s momentum surge. The $2,849 level (50-day EMA) gives the first defense while the recent breakout point near $2,700 offers secondary support. Below that, the monthly low at $2,620 is the line in sand – any weekly close beneath negates recovery thesis entirely.
There are signs of increased buying activity as long as ETH stays above the previously recaptured 50-day EMA. On the daily chart, a cup-and-handle formation has formed making $3,200 the price target after an effective breakout, meanwhile, the psychological resistance at the $3,000 level should be quite sticky. Provides additional validity to the rally.
Bulls Require Decisive Close Above $3,021 to Confirm Trend Change
If the price is able to recover the 20-day EMA at $3,021 on a daily closing basis, the trend improves with targets at $3,176. Meanwhile, the inflow of $1.06 billion in digital asset investment products, after four weeks of outflows, shows solid support to extend the uptrend, along with increasing interest from institutional investors in the undervaluation narrative proposed by CryptoQuant.
The bitcoin and ethereum pullbacks have erased both July and August VWAP as well as the $3,000 mR1. If $2,600 gives way, I would likely start de-leveraging my illiquid spot bags (gaining exposure vs USDt elsewhere) and yields in somewhat greater discretionaries.
Based on the structure and momentum in both ETH and broader crypto markets, if Ether can take out the prevailing September high, an extension towards $3,200-$3,370, and possibly June peak, would be the upside objectives. The upside target will be dependent on BTC not imploding.