Ethereum Darts Through $2,840 as Bulls Test ZK Privacy Catalyst Against Monthly Pivot Resistance

Market Structure Shifts Higher
- ETH reclaims the psychologically crucial $2,800 zone after December’s 26.7% washout
- Institutional accumulation intensifies with BitMine’s $70M purchase signaling confidence
- Privacy protocol launch and ETF dynamics create dual catalysts for price discovery
Ethereum climbed 3.8% this week to $2,839.74, clawing back from December’s devastating drop that erased over a quarter of its value. The recovery gained momentum as BitMine’s $70 million accumulation during the recent downturn validated institutional appetite, while the launch of ZK Secret Santa protocol added technical innovation to the fundamental backdrop. The main question for traders is: can ETH sustain this bounce above the critical $2,800 psychological level, or will sellers defend the monthly pivot resistance at $3,176?
| Metric | Value |
|---|---|
| Asset | ETHEREUM (ETH) |
| Current Price | $2839.74 |
| Weekly Performance | -3.84% |
| Monthly Performance | -26.71% |
| RSI (Relative Strength Index) | 35.6 |
| ADX (Average Directional Index) | 43.2 |
| MACD (MACD Level) | -160.38 |
| CCI (Commodity Channel Index, 20-period) | -92.87 |
RSI at 47.5 Signals Room to Run After December Capitulation
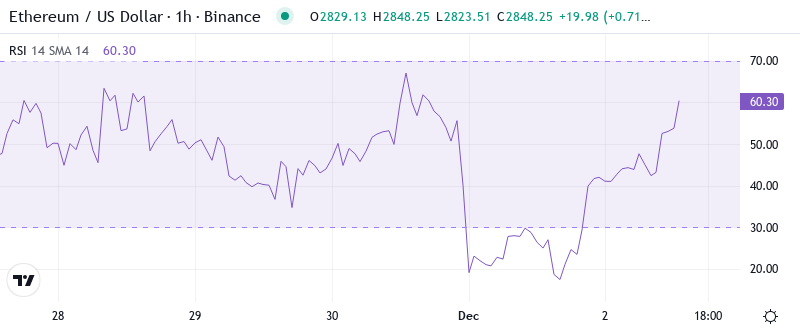
RSI sits at 47.52 on the daily timeframe, marking neutral territory after plunging from overbought conditions above 70 in early December. This reset from extreme levels mirrors the September configuration when ETH consolidated between 45-55 RSI before launching its Q4 rally. The oscillator’s current positioning – neither stretched nor oversold – suggests the market has digested December’s profit-taking and institutional selling pressure from ETF outflows.
What’s revealing is how RSI behaved during BitMine’s $70M accumulation phase – it barely budged from the mid-40s despite significant buying pressure. This absorption pattern typically precedes stronger moves as it indicates sellers have exhausted their inventory at current levels. So for swing traders, this balanced RSI reading combined with the ZK privacy catalyst deployment means entries remain attractive with room for momentum to build in either direction.
ADX at 43.2 Shows Mature Downtrend Losing Steam
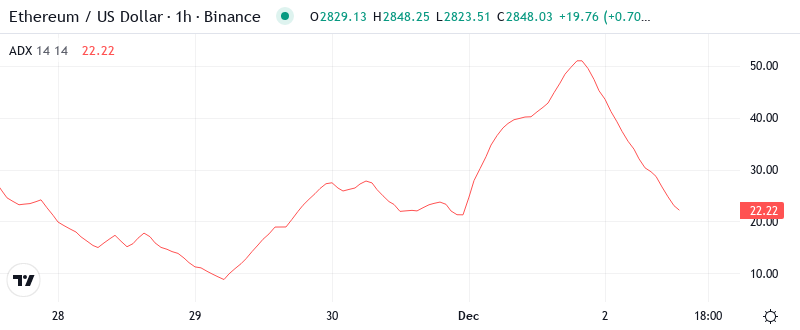
At the level of 43.24, the ADX entry indicates that December’s downtrend reached extreme conviction but now shows signs of exhaustion. Basically, being in this zone above 40 marks the kind of trending conditions that often precede reversals – the selling pressure that drove ETH down 26.7% last month has matured to unsustainable levels. The shift becomes more interesting when considering that ADX peaked near 50 during the height of December’s selloff.
To clarify, the ADX is indicating that we are transitioning from a strong directional move to a potential consolidation or reversal phase. This aligns perfectly with the technical bounce off $2,620 support and the fundamental shift created by institutional accumulation. Therefore, day traders should adjust their strategies from trend-following to range-trading approaches, at least until ADX drops below 25 to signal the next directional move.
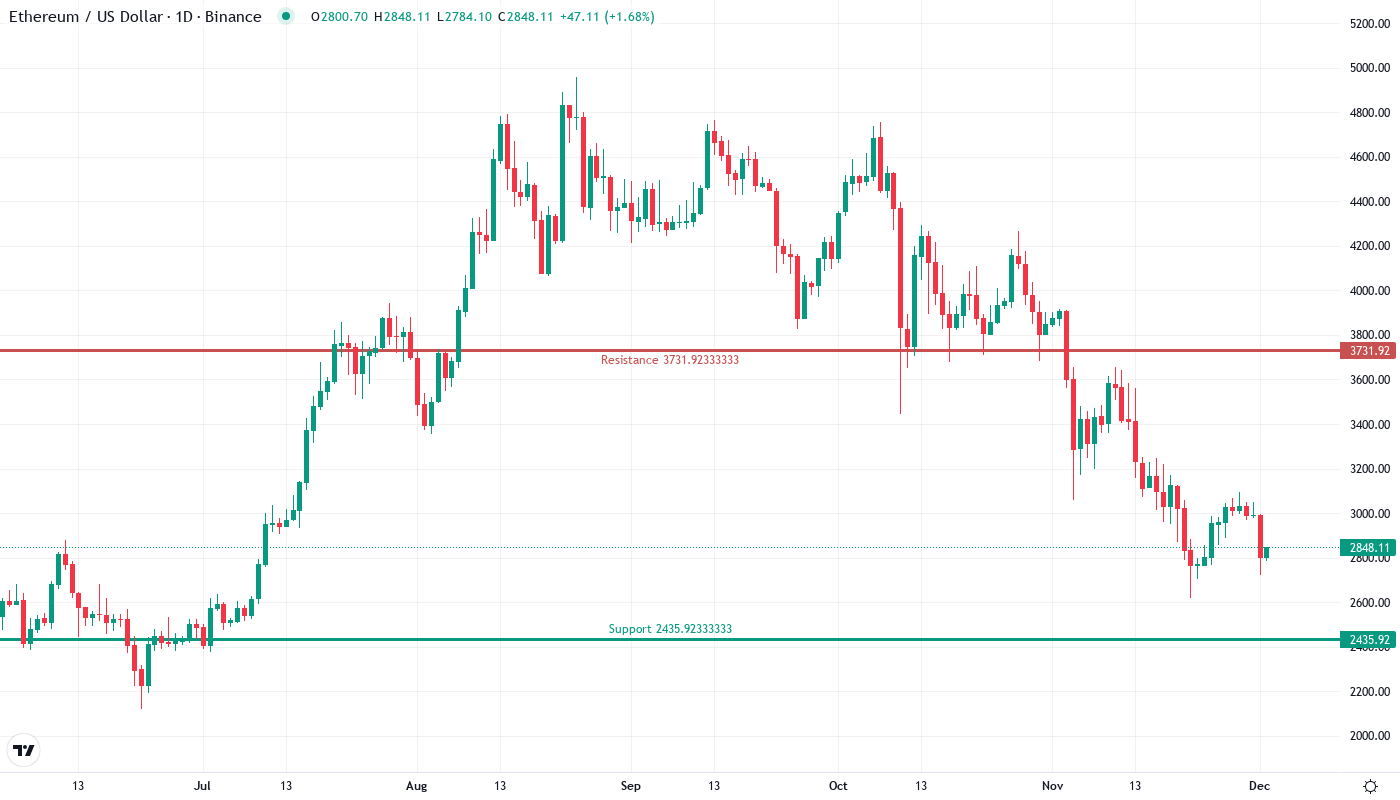
20-Day EMA at $3,039 Becomes First Major Resistance Test
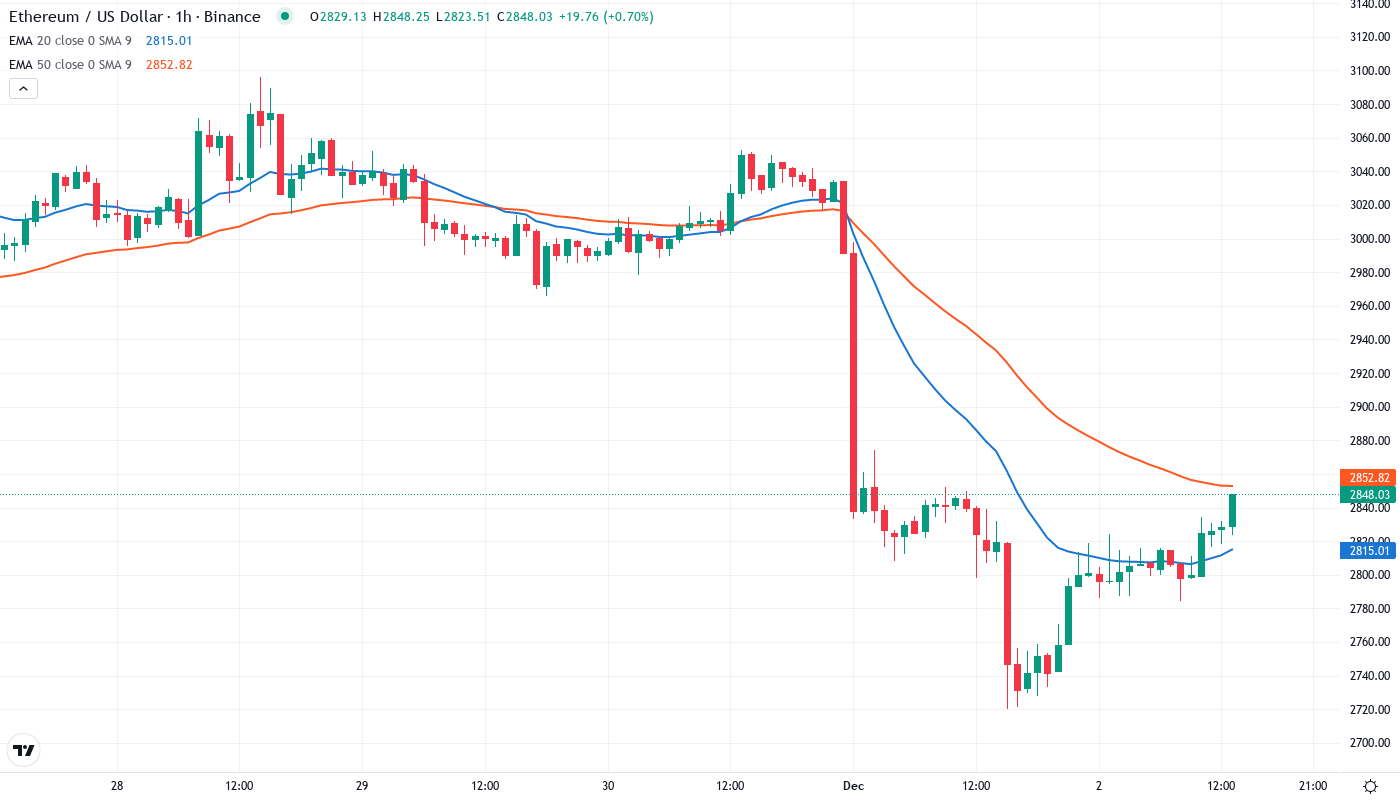
Price action reveals a clear hierarchy through the EMA ribbons. ETH currently trades below the entire moving average stack, with the 10-day EMA at $2,936 providing immediate overhead resistance. More significantly, the 20-day EMA at $3,039 and 50-day EMA at $3,162 have compressed together, creating a formidable resistance cluster that coincides with December’s breakdown level. This confluence zone between $3,039-$3,162 represents where trapped longs from last month will likely defend their exits.
Looking at the longer-term averages, the 100-day EMA rests at $3,293 while the 200-day EMA sits distant at $3,481 – both well above current price action. The fact that ETH trades below all major EMAs confirms the intermediate bearish structure remains intact despite this week’s bounce. That former support area at $3,039 now transforms into a red line for the bulls to overcome, especially with the Fusaka upgrade approaching and potential ETF flow dynamics shifting.
Monthly Pivot at $3,176 Gates Serious Recovery Attempt
The immediate resistance stacks between the 20-day EMA at $3,039 and the monthly pivot point at $3,176, where December’s breakdown accelerated. This zone gains additional weight from psychological round numbers – traders will watch the $3,000 and $3,100 levels closely as ETH attempts to rebuild structure. Above that, the monthly R1 at $3,731 and R2 at $4,472 seem distant given current momentum, though the ZK privacy implementation could provide unexpected catalyst strength.
Bulls defend multiple support layers with surprising conviction this week. The monthly S1 at $2,435 provided a safety net during December’s cascade, while immediate support has formed at the psychological $2,800 level. More importantly, the $2,620 monthly low has been tested and held, suggesting accumulation rather than distribution at these levels – validated by BitMine’s strategic entry.
This configuration resembles a base-building pattern rather than a dead cat bounce. The market structure signals buyer’s power as long as they can keep $2,800 defended on any retracement. With institutional players like BitMine positioning during weakness and technical innovations like ZK Secret Santa potentially expanding use cases, the foundation appears stronger than price action alone would suggest.
Bulls Need Decisive Close Above $3,039 to Confirm Reversal
Bulls require a decisive daily close above the 20-day EMA at $3,039 to shift near-term momentum positive. Such a move would trap December shorts and likely trigger a squeeze toward the monthly pivot at $3,176, especially if ETF flows reverse from recent outflows to inflows around the Fusaka upgrade. The combination of technical reclaim and fundamental catalysts could propel ETH toward the 50-day EMA at $3,162 in the coming sessions.
The setup fails if price hard rejects at the $3,000 psychological resistance and falls back below $2,800 on volume. This would signal that December sellers remain in control and would likely flush positions down to retest the $2,620 monthly low. A breakdown below that critical support would open an air pocket to the monthly S1 at $2,435, potentially trapping recent institutional buyers like BitMine.
Given the technical configuration with RSI reset to neutral and ADX signaling trend exhaustion, the most probable short-term path sees ETH consolidating between $2,800-$3,039 while digesting December’s decline. The ZK privacy protocol launch and shifting ETF dynamics provide asymmetric upside catalysts that could surprise bearish positioning, making patient accumulation the preferred strategy for position traders.