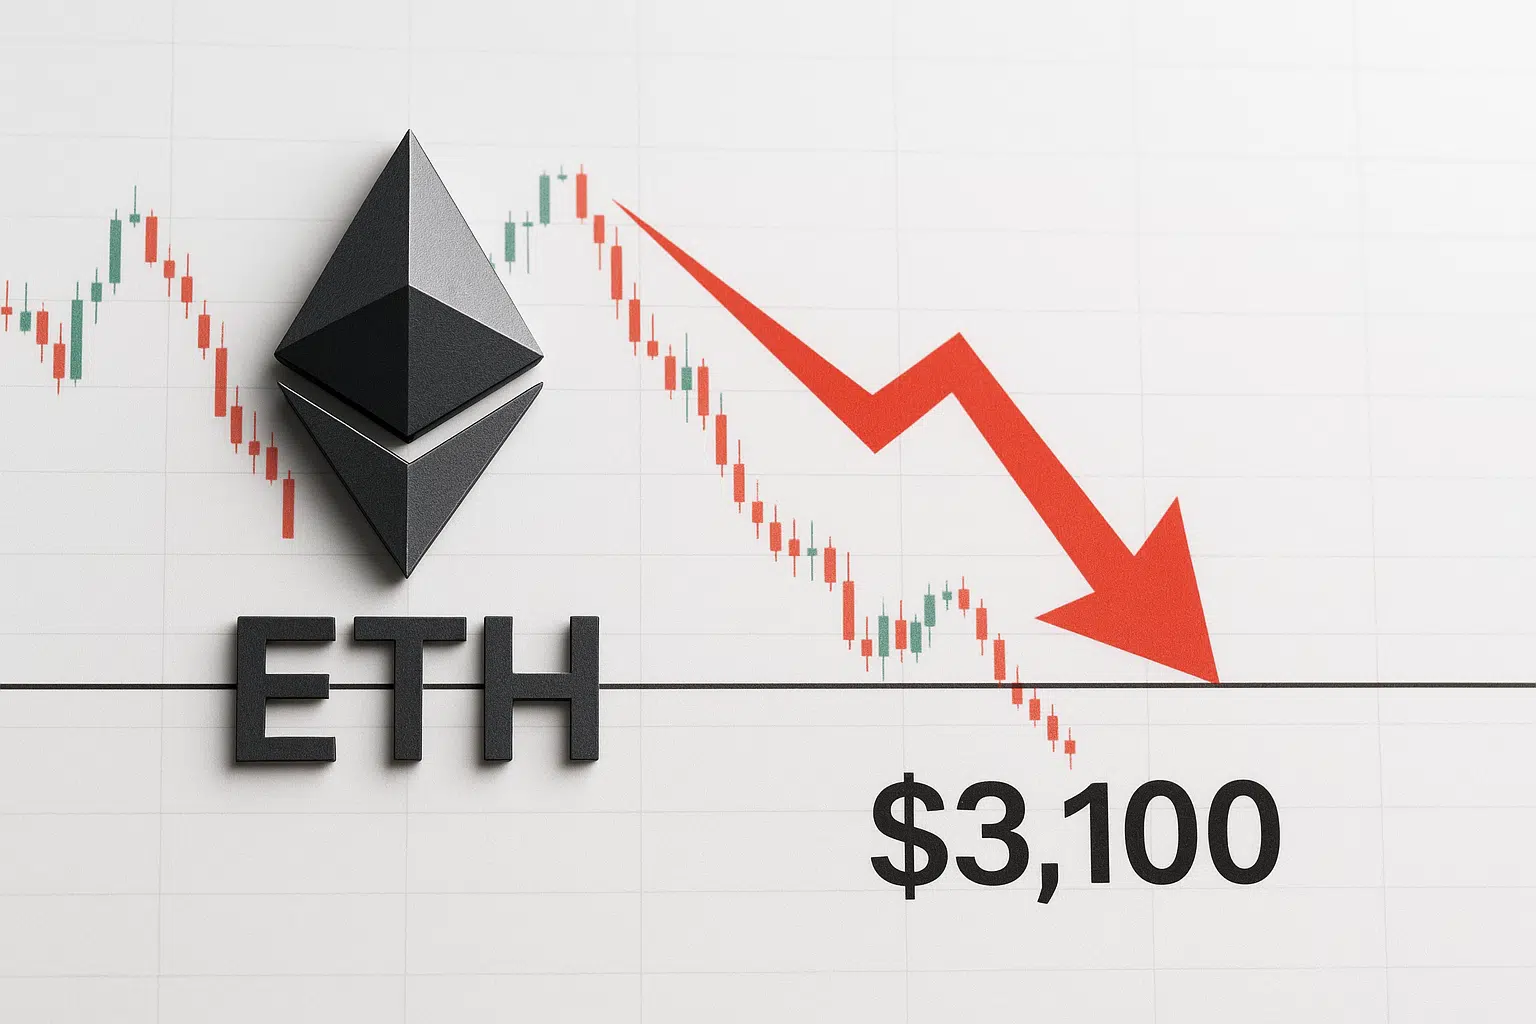
Ethereum Darts Below $3,100 as Strategic Shift Meets Technical Resistance
Market Structure Shifts Lower
- ETH tumbles 22% monthly, testing December support zones while Buterin calls for base-layer stability
- Technical indicators flash mixed signals with RSI at 35.16 suggesting oversold bounce potential
- Strategic protocol changes clash with heavy resistance stack between $3,376 and $3,685
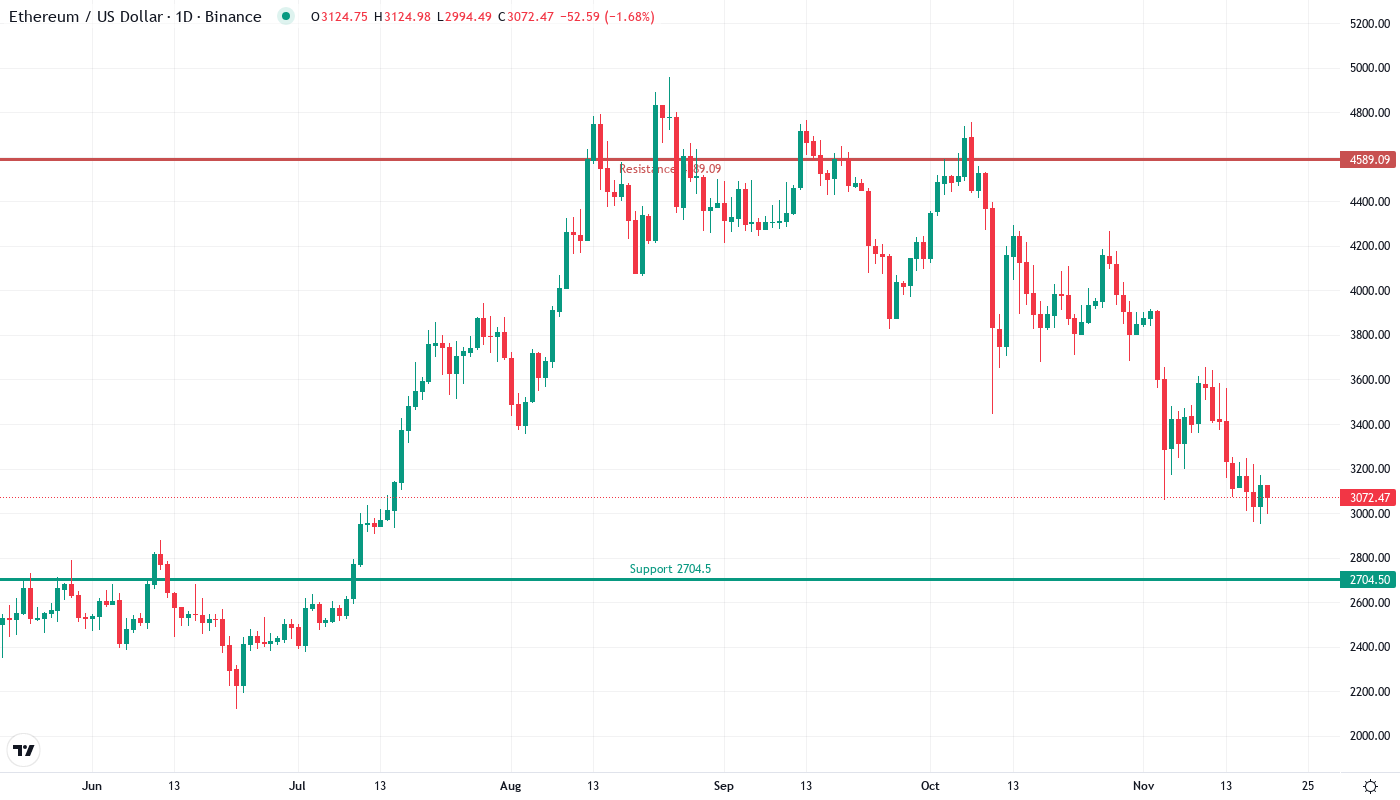
Ethereum kicked off 2025 with a devastating 22.27% monthly decline, sliding from December highs near $4,266 to current levels at $3,096. The second-largest cryptocurrency shed over $1,100 in value as Buterin’s call for greater base-layer stability coincided with a technical breakdown below multiple support levels. What’s interesting is how the strategic shift announcement failed to arrest the decline – instead amplifying uncertainty among traders already grappling with heavy overhead resistance. The main question for traders is: can ETH reclaim the crucial $3,200 level that analysts identify as the gateway to recovery, or will the protocol changes create additional selling pressure?
| Metric | Value |
|---|---|
| Asset | ETHEREUM (ETH) |
| Current Price | $3096.94 |
| Weekly Performance | -9.46% |
| Monthly Performance | -22.27% |
| RSI (Relative Strength Index) | 35.2 |
| ADX (Average Directional Index) | 42.3 |
| MACD (MACD Level) | -215.76 |
| CCI (Commodity Channel Index, 20-period) | -106.04 |
Oversold RSI at 35.16 Matches Levels From August’s Pre-Rally Phase
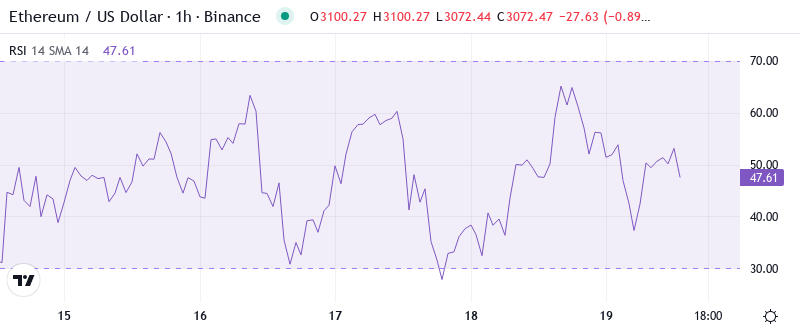
RSI sits at 35.16 on the daily timeframe, marking Ethereum’s first venture into oversold territory since the August washout that preceded a 40% surge. Historically, such extreme readings below 40 have marked significant bottoms for ETH, particularly when combined with high-profile protocol announcements like Buterin’s stability push. The weekly RSI remains healthier at 42.66, suggesting the longer timeframe structure hasn’t capitulated despite the monthly carnage.
So for swing traders, this oversold bounce setup offers compelling risk-reward, especially with Hong Kong’s digital asset tax exemptions potentially adding fresh capital flows to the ecosystem. Similar RSI configurations in September and November both resulted in 15-20% relief rallies within two weeks. It is worth mentioning that the strongest bottom signal analysts are tracking hinges on reclaiming that $3,200 psychological level – without it, oversold can become more oversold.
ADX at 42.28 Signals Mature Downtrend Nearing Exhaustion Point
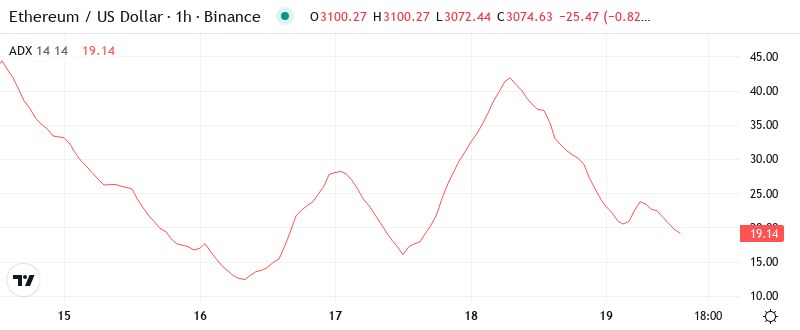
Looking at trend strength, the ADX reading of 42.28 indicates we’re dealing with a mature, conviction-driven downtrend that’s approaching historical reversal zones. Basically, being in this zone above 40 means the selling has been aggressive and directional, but also that exhaustion typically arrives soon. The last three times Ethereum’s ADX climbed above 40, significant bottoms formed within 5-10 trading days.
To clarify, the ADX is indicating that while sellers currently dominate with conviction, such extreme readings rarely sustain beyond a few weeks. Therefore, day traders should prepare for increased volatility and potential trend reversals, particularly if price action confirms support at the liquidity reset zone near $3,100. The combination of Buterin’s stability initiative and oversold technicals creates conditions where sharp reversals often emerge.
20-Day EMA at $3,376 Transforms From Support to Key Resistance Gate
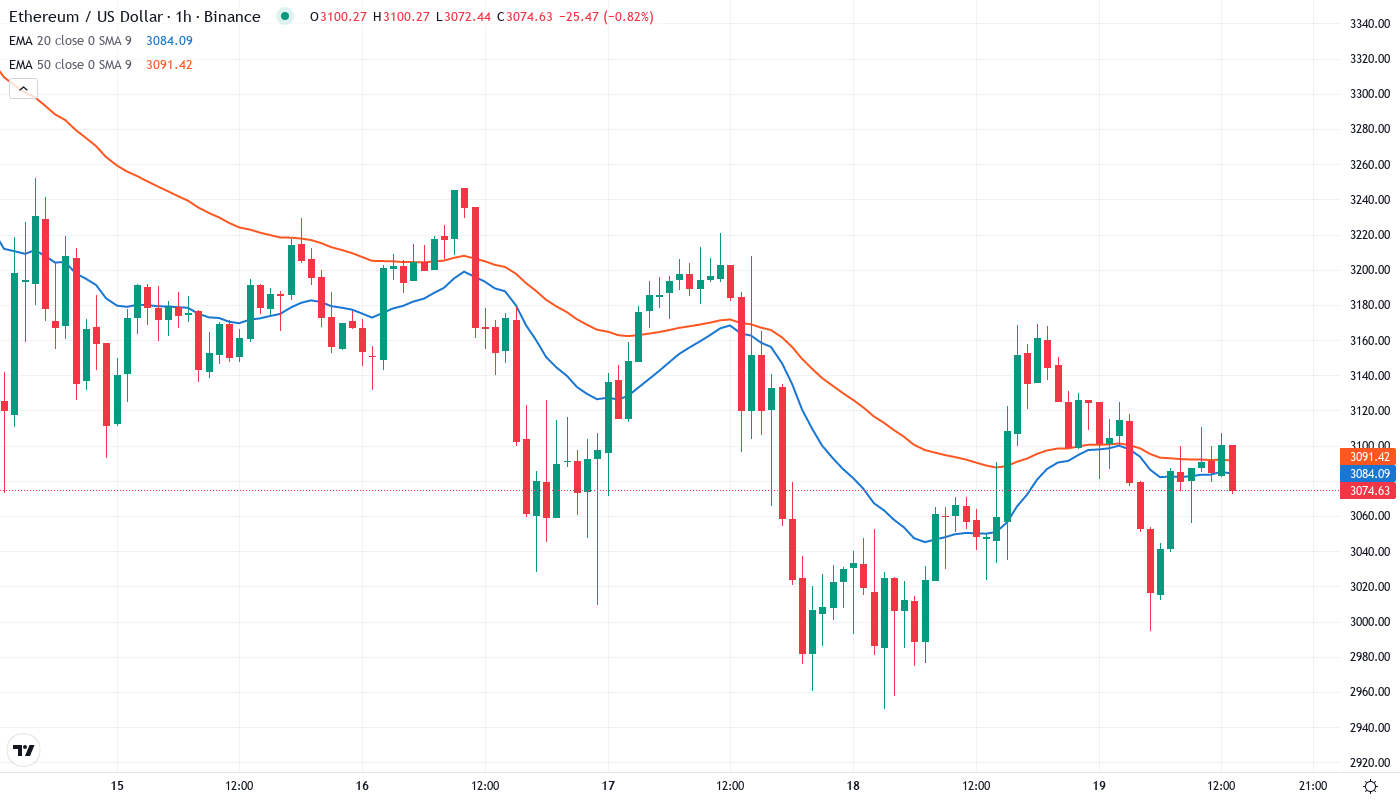
Price action reads devastatingly bearish through the EMA structure. ETH trades below the entire moving average stack – from the 10-day ($3,208) through the 200-day ($3,771). More concerning, the 20-day EMA at $3,376 changed from being a support level to a resistance one after December’s breakdown, now acting as the first major hurdle for any recovery attempt. The 50-day EMA looms even higher at $3,509, creating a formidable resistance cluster.
What’s particularly revealing is the compression developing between price and the 10-day EMA at $3,208. This level rejected advances three times in late December before finally breaking, and now transforms into the immediate resistance bulls must reclaim to shift near-term momentum. That former support area around $3,200 mentioned in analyst reports now becomes the red line for bulls to defend – lose it, and the next major support doesn’t arrive until the psychological $2,500 zone where the 200-week MA provides distant backstop.
$3,200 Level Becomes Make-or-Break Zone as Protocol Changes Loom
Above current price, sellers have stacked impressive resistance between $3,376 (20-day EMA) and $3,685 (100-day EMA), with the monthly pivot at $3,538 adding another barrier. December’s highs near $4,266 feel distant now, requiring a 38% surge just to retest. The immediate resistance starts at $3,200 – the level analysts identify as critical for confirming any bottom formation while Buterin’s base-layer stability changes create uncertainty about near-term demand.
Bulls defend multiple support layers with surprising resilience, as evidenced by six bounces from the $3,050-$3,100 zone over the past two weeks. The monthly S1 pivot at $3,190 provides additional confluence, while weekly support at $2,475 offers a deeper safety net should current levels fail. Hong Kong’s expanded tax exemptions for digital assets could provide the catalyst needed to test these support zones’ strength.
This configuration resembles a classic liquidity reset pattern where overleveraged positions got flushed during December’s slide. The structure signals buyers’ power remains intact as long as they keep $3,096 defended on any retracement. Crucially, the gap between current price and the 10-day EMA suggests either a sharp relief rally to close it or continued consolidation while the average descends toward price.
Bulls Require Close Above $3,200 to Confirm Bottom Formation
Should price reclaim and close above $3,200 with conviction, the technical picture shifts dramatically. Bulls would then target the 20-day EMA at $3,376 while Buterin’s stability initiatives and Hong Kong’s regulatory clarity provide fundamental tailwinds. A sustained move above $3,376 opens the path toward $3,500 where the 50-day EMA awaits.
The setup fails if ETH breaks below $3,050 on volume, triggering stops clustered beneath December’s support tests. Such a breakdown would likely flush positions down to $2,500 where the 200-week MA lurks – representing another 20% downside from current levels. This would trap recent buyers who entered on the “strongest bottom signal” narrative.
Given the oversold RSI, exhausted ADX reading, and multiple support confluences, the most probable short-term path sees ETH consolidating between $3,050-$3,200 before attempting a relief rally toward the 20-day EMA. Protocol uncertainty needs resolution before any sustainable recovery takes hold.