Ethereum Classic Tumbles 15% as Scalability Concerns Mount Following Kaspa Comparisons
Market Pulse
- ETC sheds $2.16 in a week, wiping out November’s gains entirely
- Scalability narrative turns bearish as transaction throughput lags competitors
- Bulls defend $12.38 despite devastating momentum breakdown
Ethereum Classic has taken a devastating 15.45% tumble over the past month, with the price action erasing three months of attempted recovery in just four weeks. The collapse from December’s $14.47 highs to current levels at $12.38 came as unfavorable scalability comparisons with newer networks like Kaspa hit the wires, triggering stop-loss cascades below key technical levels. The main question for traders is: can ETC’s battered bulls defend current support, or will the technical breakdown accelerate toward single digits?
| Metric | Value |
|---|---|
| Asset | ETHEREUM CLASSIC (ETC) |
| Current Price | $12.38 |
| Weekly Performance | -6.57% |
| Monthly Performance | -15.45% |
| RSI (Relative Strength Index) | 41.6 |
| ADX (Average Directional Index) | 28.5 |
| MACD (MACD Level) | -0.56 |
| CCI (Commodity Channel Index, 20-period) | -142.42 |
RSI at 41.64 Signals First Oversold Territory Since Summer Washout
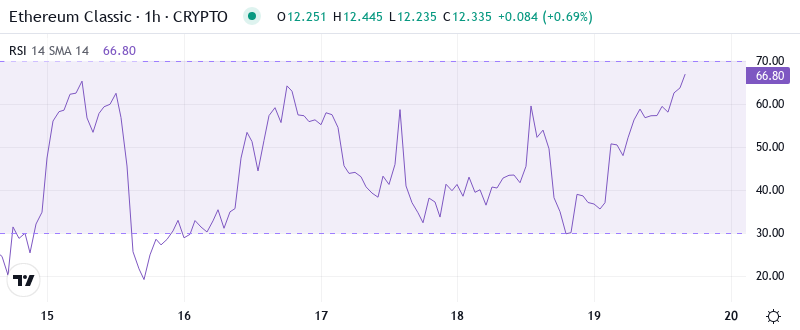
Reading the oscillator at 41.64 on the daily timeframe, traders see momentum exhaustion that hasn’t appeared since August’s capitulation phase. What’s particularly revealing is how RSI barely budged despite the 15% monthly decline – suggesting sellers are running out of steam rather than accelerating their assault.
Similar RSI configurations in late summer preceded sharp relief bounces of 20-30%, though those came with stronger market-wide conditions. So for swing traders, this oversold reading creates opportunity, but only if broader crypto sentiment shifts from the current risk-off mode that’s gripped altcoins since early December.
ADX Climbs to 28.46 – Trend Followers Gain Edge Over Range Traders
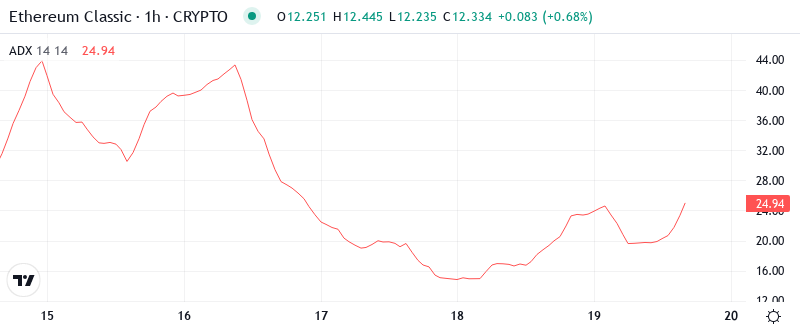
At the level of 28.46, the ADX entry indicates that the trend is gaining power but it’s not at the extremes yet. Basically, being in this zone means ETC has shifted from November’s choppy consolidation into a defined downtrend that rewards momentum strategies over mean reversion plays.
To clarify, the ADX is indicating that we are switching from boundary conditions to a trending state – and with price below all major averages, that trend points decisively lower. Therefore, day traders should suit their strategies to this change, focusing on selling rallies rather than buying dips until ADX drops back below 25 or price reclaims the 20-day EMA.
Price Trapped Below Entire EMA Ribbon Since Mid-December Break
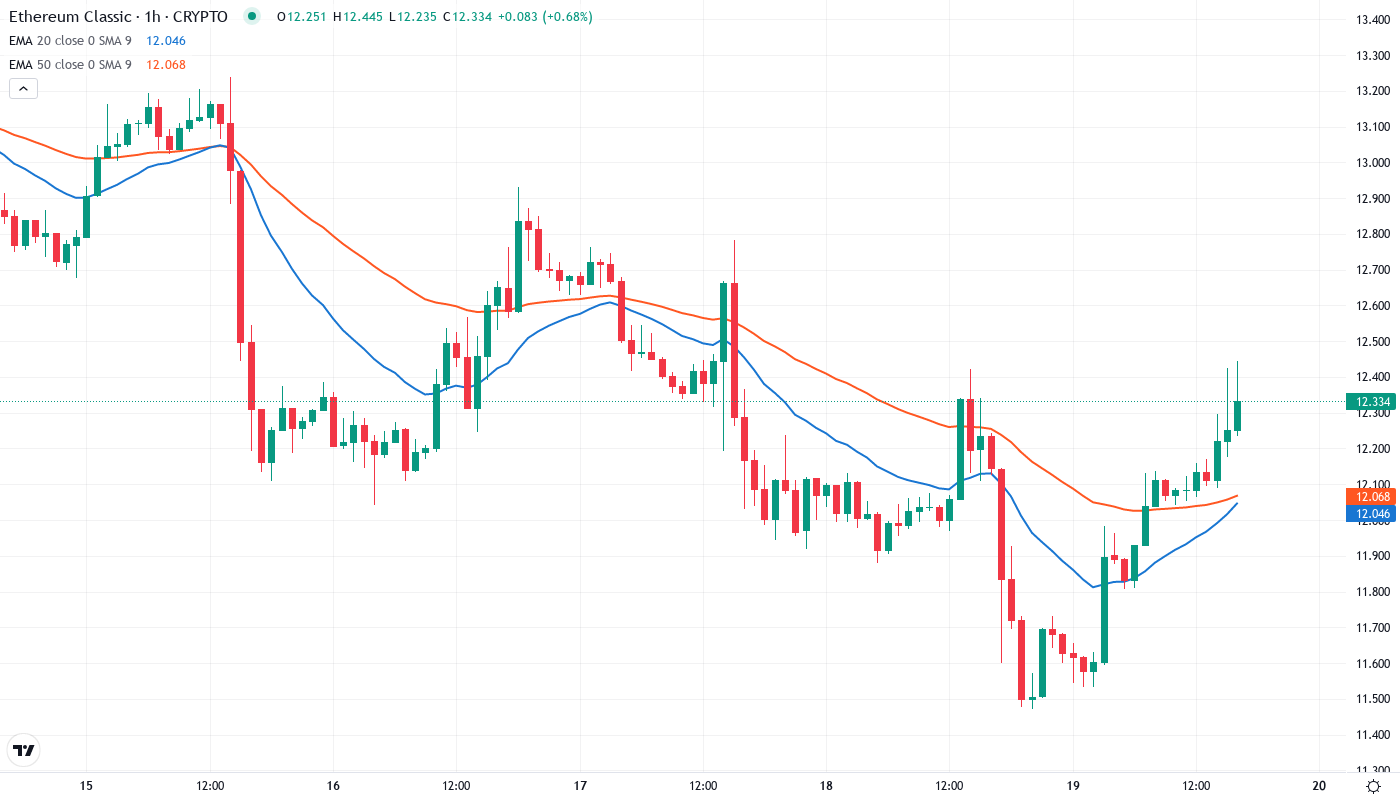
Price action tells a brutal story through the EMA ribbons. ETC trades below the 10-day ($12.59), 20-day ($13.02), and crucially, the 50-day EMA at $14.13 – creating a bearish stack that’s rejected every relief attempt since the Kaspa comparison news triggered December’s breakdown.
What’s more concerning is the compression between the 10-day and 20-day EMAs, now separated by just $0.43. This tight clustering above current price creates a resistance ceiling that bulls must convincingly break to shift momentum. The 50-day EMA at $14.13, which supported price throughout November, now looms as distant resistance nearly 15% overhead.
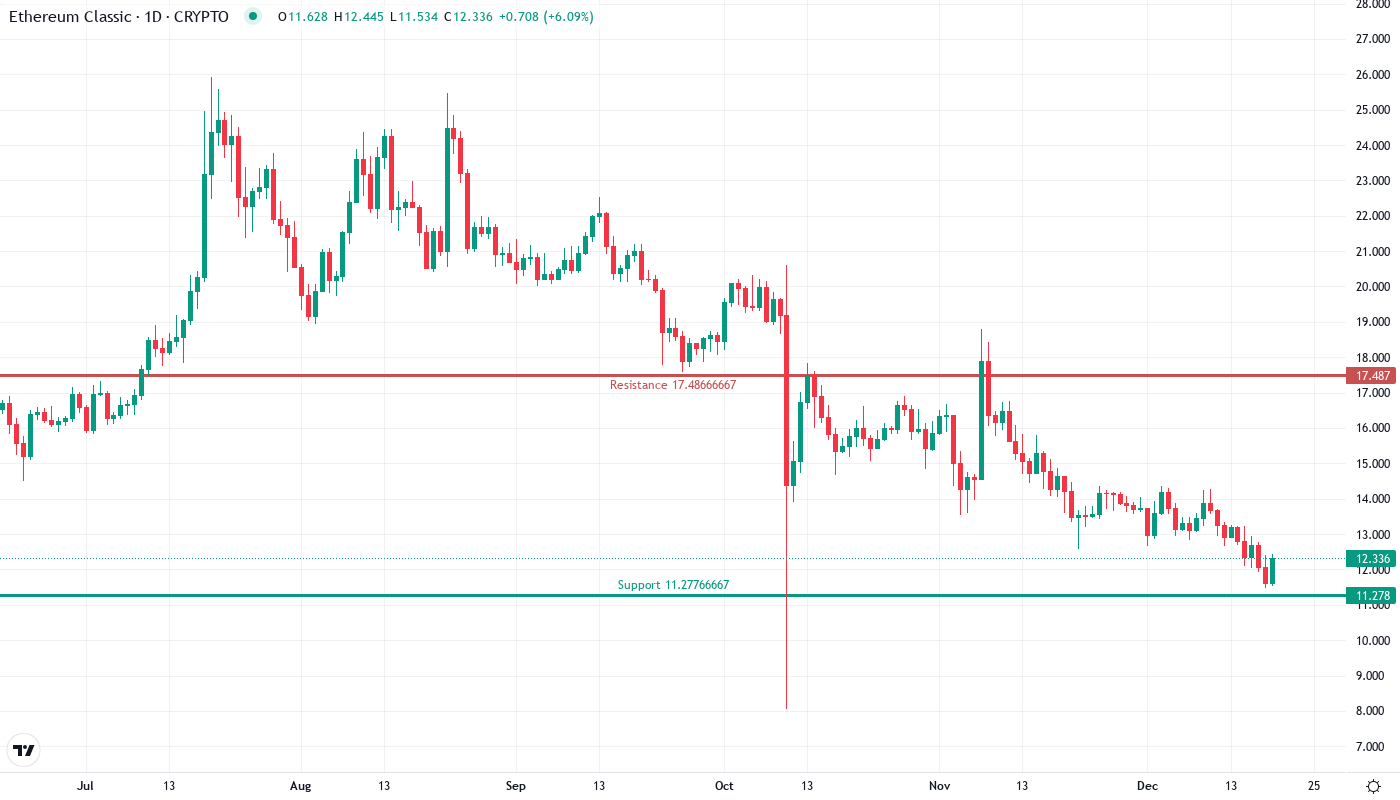
Support Stacks at $11.47 While Resistance Clusters From $13.02 to $14.47
The immediate resistance is set at the zone from $13.02 (20-day EMA) to December’s high of $14.47, where monthly pivot points meet prior support-turned-resistance. This $1.45 range represents a 17% climb from current levels – a significant hurdle given the weakened technical structure and negative scalability narrative.
Bulls defend support at December’s low of $11.47, a level that’s held through multiple tests despite heavy selling pressure. Below that, the psychological $10 level and yearly pivot at $8.83 mark the next major support zones, though reaching those would represent capitulation-level selling.
Crucially, the market structure shows sellers in control as long as price remains below $13.02. Each failed attempt to reclaim the 20-day EMA reinforces the bearish bias, while the widening gap between price and the 50-day EMA signals deteriorating trend strength that typically precedes extended corrections.
Bulls Need Decisive Close Above $13.02 to Halt Bearish Momentum
Bulls require a decisive close above the 20-day EMA at $13.02 with volume to signal even a temporary shift in momentum. Such a move would target the 50-day EMA at $14.13, though sustained bullish momentum seems unlikely without addressing the scalability concerns that triggered this selloff.
The bearish domino falls if price loses $11.47 support on volume – this would trap recent bottom-fishers and likely trigger acceleration toward the psychological $10 level. With Kaspa’s superior throughput dominating crypto headlines, ETC needs fundamental catalysts beyond technical bounces to sustain any recovery.
Given the technical configuration and persistent scalability narrative headwinds, the most likely short-term path is for ETC to consolidate between $11.47-$13.02 before bears attempt another leg lower. Without addressing the transaction throughput gap highlighted in recent comparisons, technical bounces will likely remain shallow and short-lived.