ETH Darts Through December’s Resistance as Institutional Flows Shift

Market Structure Shifts Higher
- Ether ETF products
- Pantera Institutional Fund’s notice of a 749% increase in AUM
- 1.797M ETH intraweek wallet accumulation among addresses holding 10k-100k coins
As Ethereum regained its foothold above the $3k level, institutional players on both fronts appeared indecisive on the solidity of the uptrend. While Ether ETF products, Pantera Institutional Fund’s notice of a 749% increase in AUM, and a 1.797M ETH intraweek wallet accumulation among addresses holding 10k-100k coins indicated demand was gaining steam, the ProShares ETF outflows and week over an outflow of -5.039M ETH on derivatives exchanges suggested that some were reducing their exposure ahead of further gains.
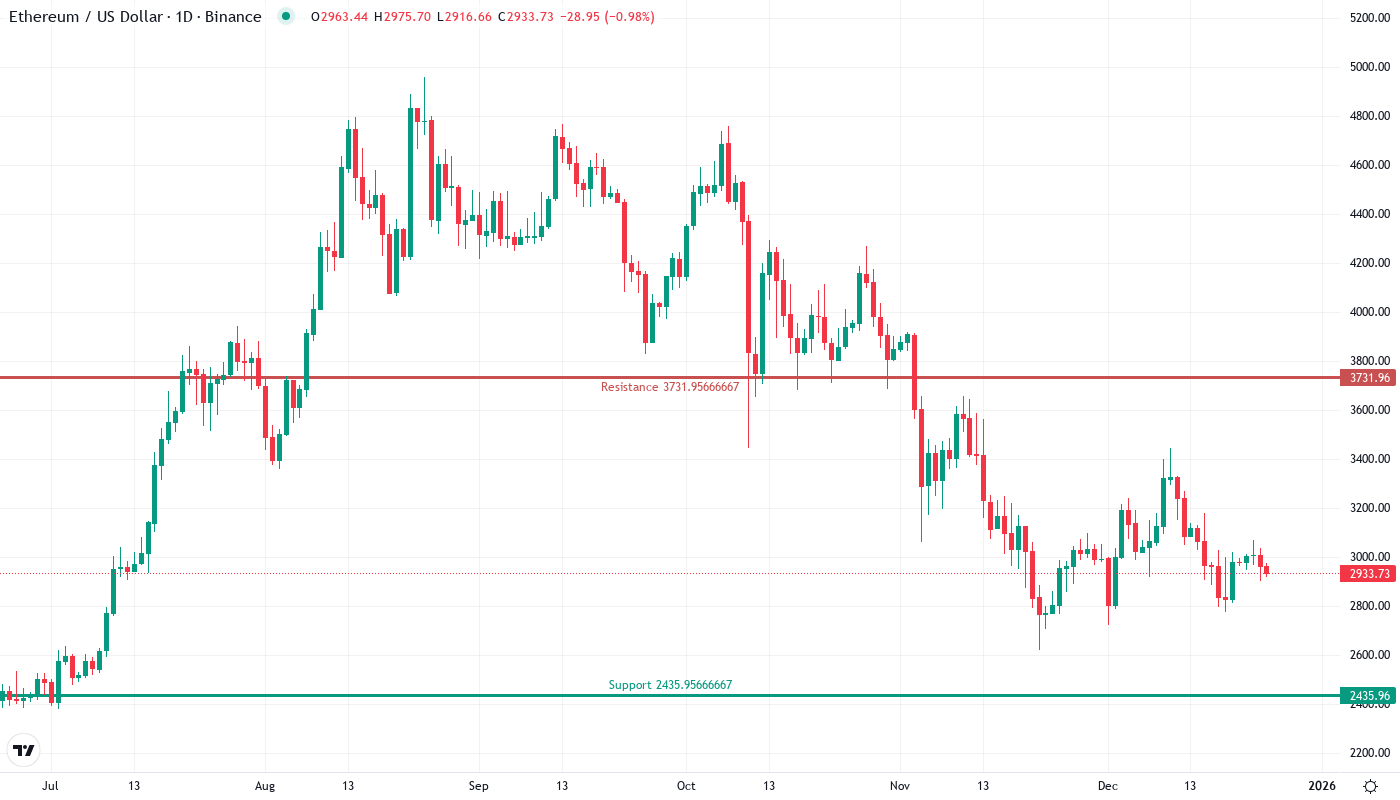
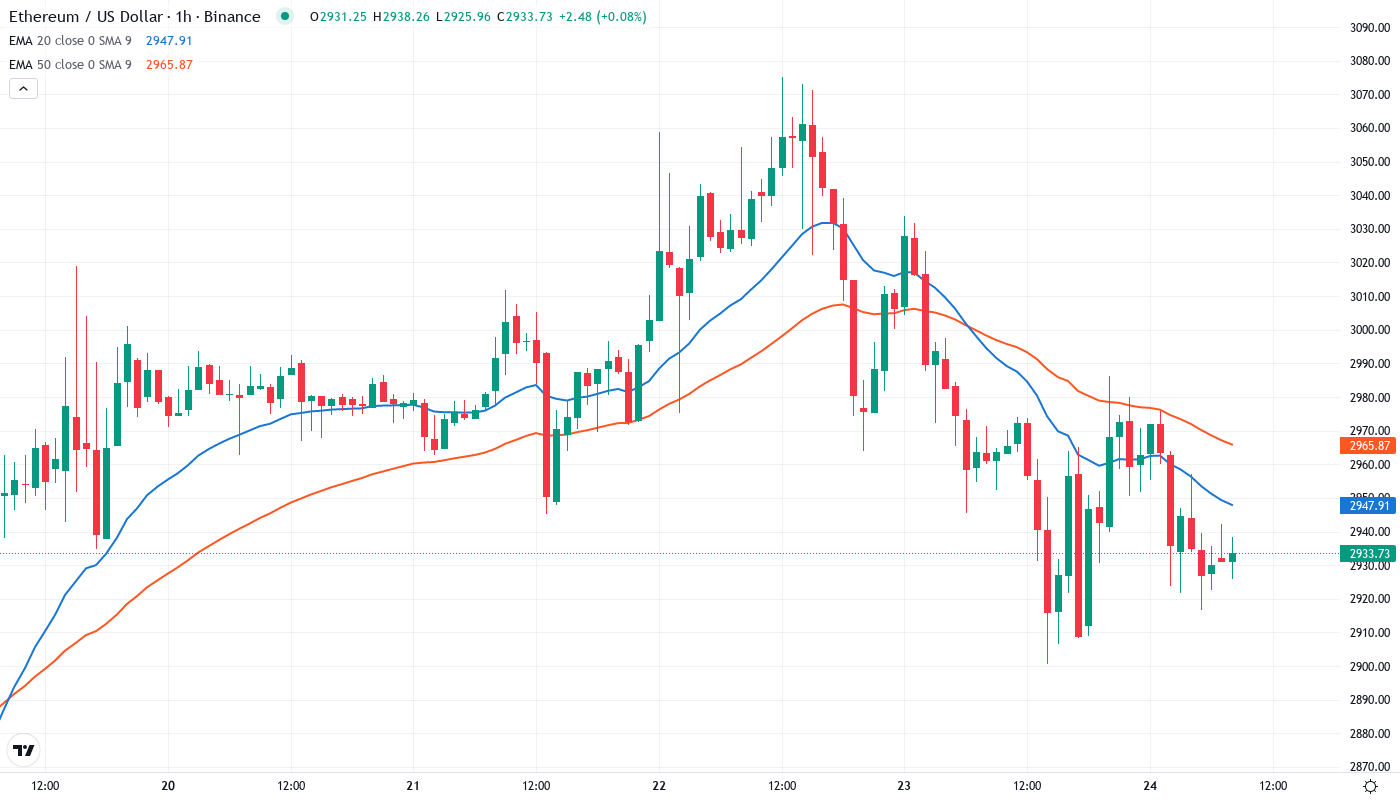
The 4-hour chart has seen ETH flip bearish after the sharp retest of the 50-day EMA flipped to a resistance zone, exacerbated by ema’s bearish cross on the 20-day EMA block on September 29. The daily RSI has fallen back into the overbought region while the hourly RSI and stochastic have turned south, though price remains above MA 50. ETH could retreat to $2,854 or $2,719 if the latter is broken, activating the H / S pattern’s target around $2,500 and the 100-DMA. The scenario can be removed by rising over $3,071.
| Metric | Value |
|---|---|
| Asset | ETHEREUM (ETH) |
| Current Price | $2931.50 |
| Weekly Performance | -0.98% |
| Monthly Performance | 4.62% |
| RSI (Relative Strength Index) | 43.3 |
| ADX (Average Directional Index) | 31.2 |
| MACD (MACD Level) | -51.27 |
| CCI (Commodity Channel Index, 20-period) | -73.72 |
Momentum Holds Mid-Range Despite Institutional Turbulence
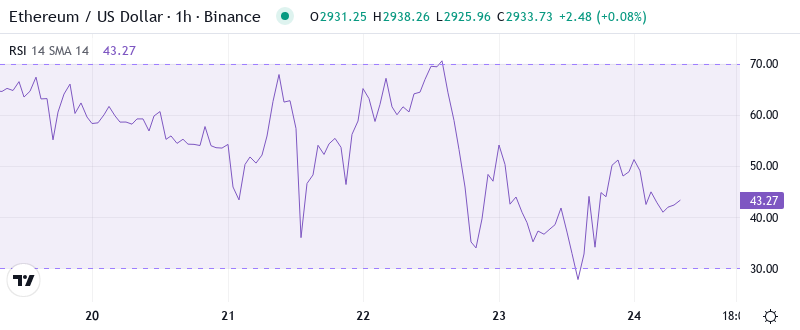
The Relative Strength Index RSI on the daily timeframe is at 46.65 which suggests bulls and bears are evenly matched following last month’s volatility. This neutral reading comes after the oscillator crashed from overbought levels above 70 in early December to oversold levels near 30 when retail outflows triggered ETF. One interesting observation is that RSI bottomed right as Trend Research began accumulating their largest amounts of the year, a similar setup to August’s capitulation right before a 35% surge.
Therefore, for swing traders, this lack of conviction could be an intended shakeout by the whale to accumulate positions at favorable prices before the ETF is approved. This isn’t the only reason to anticipate ETF approval. The recent instability of the yuan and an increase on the tariff’s placed on Chinese goods will see some capital flow to Bitcoin.
ADX at 31.19 Confirms Trend Strength Building From Choppy Base
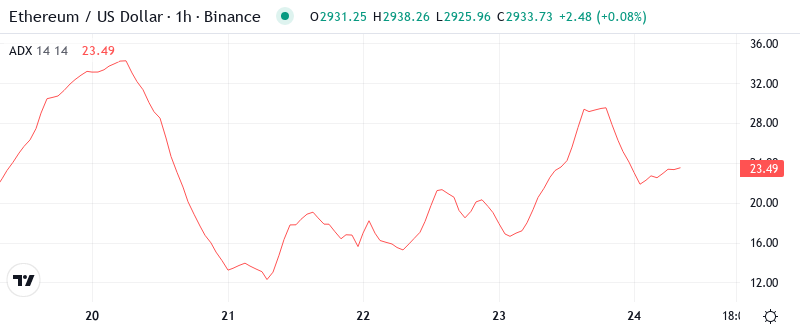
The ADX shows investors the amount of force behind any given price movement, while it also shows if the market is in consolidation or a trend. Communatively, the DMI indicators offer a versatile and efficient tool for evaluating trend strength. Here the bulls are showing real leadership with the ADX heading higher. There haven’t been enough trades to make a decisive calculation on the ADX, yet. In the same vein, the relatively weak performance by bears is underscored by the lack of a noteworthy downtick in the ADX.
As such day-trading strategies should be adapted from range-bound mean reversion to trend-tracking methods. The spike in directional movement happened to take place during ETHZilla’s liquidation event, an occurrence that in irony strengthened the uptrend as buyers soaked up supply far quicker than sellers were able to disperse demand. ADX readings higher than 30 have, above all, statistically favored continuation plays with regard to the price action of Ethereum.
20-Day EMA Flips From Resistance to Support at $3,011
The upsurge in momentum indicators and the MACD suggests that higher-low remains intact, targeting further recovery towards the 200-day EMA at $3,195 if support around the 50-day EMA holds. The provisioning of the EMA ribbon at the relentless 20-day EMA has returned to bullish volatility perspectives suggesting a retest of the $3,375 resistance.
One interesting point is that the 50-day and 100-day EMAs are compressing and the 100-day EMA is all the way down at $3,175. These tightening ranges usually lead to explosive moves and getting the 50-day EMA back after mass institutional selling turns that level into the red line that bulls must defend. The 200-day EMA is still far above at $3,386, which gives bulls a lot of room to the upside should momentum return.
Resistance Clusters Between $3,055 and $3,175 as Bulls Eye Recovery
Sellers have bonded together resistance areas above present valuations, which are closely linked with technical and emotional junctions. The nearby obstruction is seen at $3,055 where the 30-day EMA closes in with the weekly PP, making a double block that turned down price on two occasions this week. Moreso, the monthly R1 at $3,171 matches up beautifully with the 100-day EMA on the daily, which traders usually refer to as a confluence zone.
Bulls are currently the more vigilant sentries of the support structure, having successfully defended $2,854 during the panic of the ETF outflow. The monthly pivot at $2,931, where price is now, will be in the first line of defense, with the 50-day EMA offering more support. The monthly S1 is far below at $2,435 but this would be the catastrophic stop level where the entire bullish thesis would come undone.
The range-bound structure between $2,854 and $3,175 looks like a coiled spring. Declining volatility indicates that a breakout is around the corner. The fact that Ether was able to soak up the selling from ETHZilla and the outflows from ETFs and still hold above crucial moving averages shows a level of underlying strength that the price action didn’t show.
Bulls Must Reclaim $3,055 to Validate Recovery Momentum
If Ethereum manages to close on a daily basis above $3,055, then the way is paved to test the key $3,200 level, a region that previously prompted profit-taking. The technical barrier of resistance at $3,175 at which a breakthrough would demand considerable upside momentum, could be facilitated by another round of whale buying or constructive ETF inflows.
If the bearish scenario comes to pass, add to short exposure on a daily close below $2,700 and look for a mostly straight-line decline towards $2,152 before consolidating above $2,000. Use that as Level 3 accumulation for the long-tail scenario playing out.
With the neutral momentum readings and healthy EMA structure, Ethereum is well-placed to consolidate between $2,854 and $3,055 as it digests the recent institutional repositioning. A catalyst will be required – either renewed whale accumulation or ETF flow recovery – to break out of this compression zone.