Dogecoin Tests Six-Month Low as Whales Accumulate 550M Tokens Near Critical Support

Market Pulse
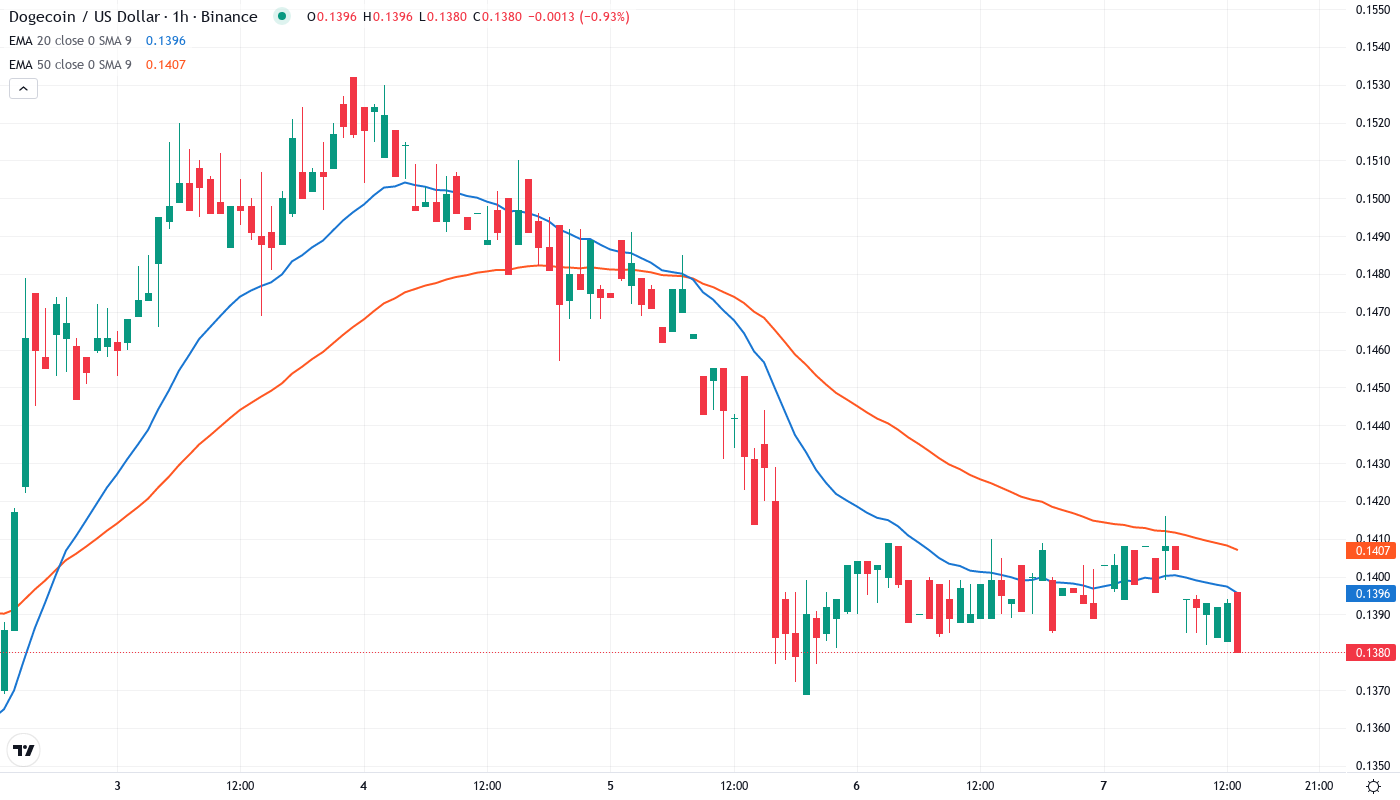
- DOGE slumps to $0.138, matching six-month lows despite whale accumulation of 550 million tokens
- Buenos Aires crypto tax approval provides fundamental support as price tests inverse head-and-shoulders neckline
- Technical indicators flash oversold across timeframes while descending triangle pattern keeps $0.40 target alive
Dogecoin endured a devastating drop this month, tumbling 15% to $0.138 – its lowest print since June. The meme coin’s monthly performance reads even worse at -15%, with the three-month decline approaching 40% as broader crypto markets turned risk-off. Yet beneath the surface, whales accumulated 550 million DOGE tokens precisely as price tested critical support, suggesting smart money sees value at these depressed levels. The main question for traders is: can this institutional accumulation and Buenos Aires’ groundbreaking crypto tax approval provide enough fuel to validate the inverse head-and-shoulders pattern targeting $0.40?
| Metric | Value |
|---|---|
| Asset | DOGECOIN (DOGE) |
| Current Price | $0.14 |
| Weekly Performance | -6.88% |
| Monthly Performance | -15.02% |
| RSI (Relative Strength Index) | 38.0 |
| ADX (Average Directional Index) | 40.6 |
| MACD (MACD Level) | -0.01 |
| CCI (Commodity Channel Index, 20-period) | -103.06 |
RSI at 37.97 Signals First Oversold Territory Since August Capitulation
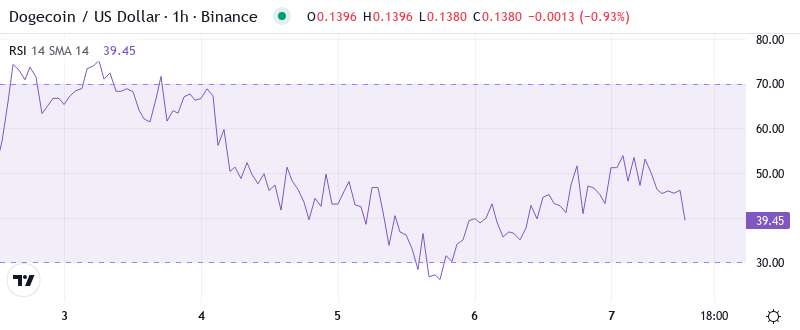
Momentum indicators paint a clear oversold picture across multiple timeframes. RSI sits at 37.97 on the daily chart, marking the first sub-40 reading since August’s washout that preceded a 35% relief rally. The weekly timeframe shows even deeper exhaustion at 37.65, while monthly RSI cratered to 46.49 – its lowest reading in over a year. This triple-timeframe oversold confluence historically marks significant bottoms for DOGE, particularly when combined with high-volume whale accumulation.
What’s revealing is how RSI behaved during the recent 550 million token accumulation spree. Despite continued selling pressure from retail traders, the oscillator refused to break below the psychologically important 30 level that typically signals panic capitulation. So for swing traders, this divergence between whale buying and oversold readings creates a textbook bounce setup, especially with Buenos Aires’ tax payment approval adding fundamental tailwinds to any technical recovery attempt.
ADX at 40.62 Confirms Mature Downtrend Nearing Exhaustion Point
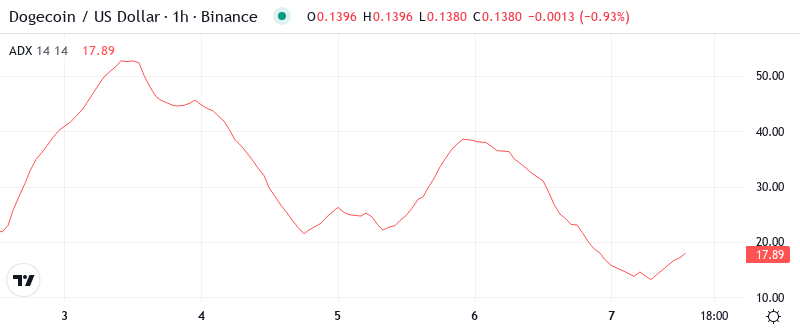
Trend strength readings tell a story of conviction behind the recent selloff, but also hint at exhaustion. At the level of 40.62, the ADX entry indicates that the downtrend carried serious momentum – readings above 40 typically mark trend extremes that precede reversals. The surge from 25 to above 40 in just three weeks shows how aggressively sellers dominated, though such vertical ADX spikes rarely sustain.
Looking at historical precedent, DOGE’s ADX touched similar extremes during the May 2021 crash and November 2022 FTX collapse – both marked significant bottoms. To clarify, the ADX is indicating that we’re transitioning from trending to potential reversal conditions. Therefore, day traders should adjust their strategies from trend-following to mean reversion setups, particularly if price can reclaim the 20-day EMA at $0.149.
20-Day EMA at $0.149 Becomes First Resistance After Supporting Price Since October
Price action through the EMA ribbons reveals the technical damage inflicted during December’s rout. DOGE currently trades below the entire moving average stack – beneath the 10-day ($0.144), 20-day ($0.149), 50-day ($0.155), and crucially, approaching the 100-day EMA at $0.167. The 20-day EMA changed from being a support level to a resistance one after three failed reclaim attempts this week, marking a clear shift in market structure.
Most telling is the compression between short and long-term averages. The 10-day through 50-day EMAs cluster within a tight $0.011 range, creating a formidable resistance zone that coincides with the inverse head-and-shoulders neckline. Bulls must power through this entire EMA cloud with conviction to validate the larger pattern. That former support area at $0.155 (50-day EMA) now transforms into a red line for the bulls to defend on any recovery attempt – losing it again would trap recent bottom-fishers who bought the whale accumulation news.
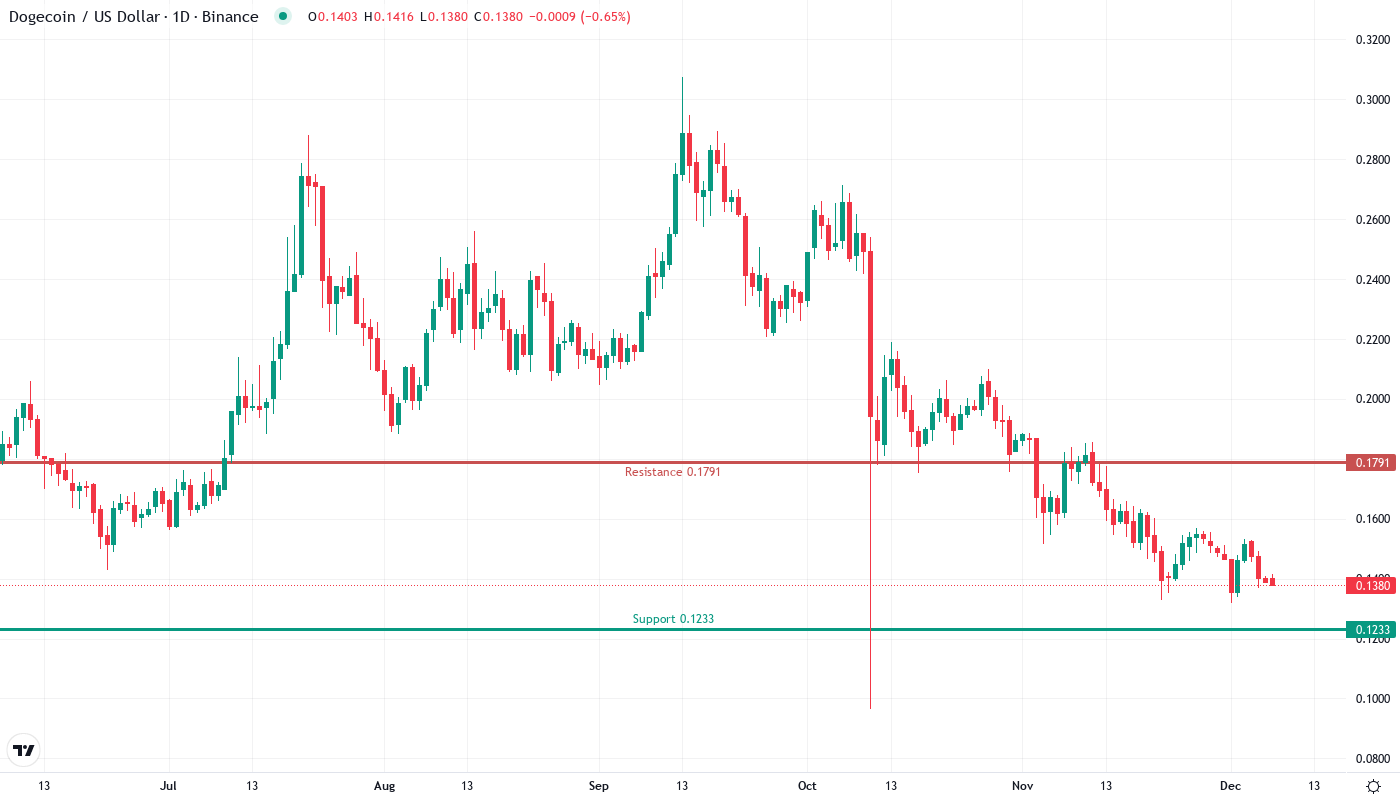
Resistance Stacks Between $0.149 and $0.167 While $0.123 Provides Final Support
The immediate resistance clusters densely between $0.149 (20-day EMA) and $0.155 (50-day EMA), where December’s breakdown point meets the monthly pivot. Above that, sellers have stacked orders at $0.167 (100-day EMA) – a level that rejected advances four times since November. The psychological $0.20 level looms as major resistance, aligning with the 200-day EMA and representing a 45% move from current levels.
Support architecture looks more constructive thanks to whale accumulation at key technical levels. The $0.138 level held six separate tests over the past week, with each bounce accompanied by above-average volume. Below lies the June low at $0.123 – a break there would invalidate the inverse head-and-shoulders pattern and likely trigger stops down to $0.10. The monthly S1 pivot at $0.1233 adds confluence to this critical zone.
Market structure reveals an intriguing dichotomy. While price action remains bearish below all major EMAs, the combination of oversold conditions, extreme ADX readings, whale accumulation, and fundamental catalysts from Buenos Aires creates a powder keg setup. The descending triangle pattern still targets $0.40 if support holds – a nearly 200% move that would require sustained momentum above $0.155.
Bulls Need Decisive Close Above $0.155 to Activate Recovery Scenario
Bulls must secure a daily close above the 50-day EMA at $0.155 to flip market structure bullish. Such a move would confirm the inverse head-and-shoulders pattern while the Buenos Aires tax integration provides ongoing fundamental support. The measured move targets $0.40, with interim resistance at $0.20 and $0.28.
The bearish scenario triggers if $0.138 fails on volume, especially if whale wallets begin distributing rather than accumulating. A breakdown below $0.123 would trap recent buyers and likely accelerate selling toward the psychological $0.10 level – erasing another 25% from current prices. Watch for RSI to lose 30 support as an early warning signal.
Given the oversold technicals, whale accumulation data, and expanding real-world adoption through Buenos Aires, the most probable near-term path sees DOGE consolidating between $0.138-$0.155 before attempting a relief rally toward $0.167. The combination of technical exhaustion and fundamental catalysts favors patient accumulation over aggressive shorting at these levels.