Dogecoin Tests Six-Month Low as Whales Accumulate 550 Million Tokens
Market Pulse
- DOGE plunged 14.2% this week to $0.1393, marking its lowest level since August
- Whales accumulated 550 million tokens despite the downtrend, signaling conviction at current levels
- Buenos Aires tax payment approval and inverse H&S pattern offer bulls hope for recovery
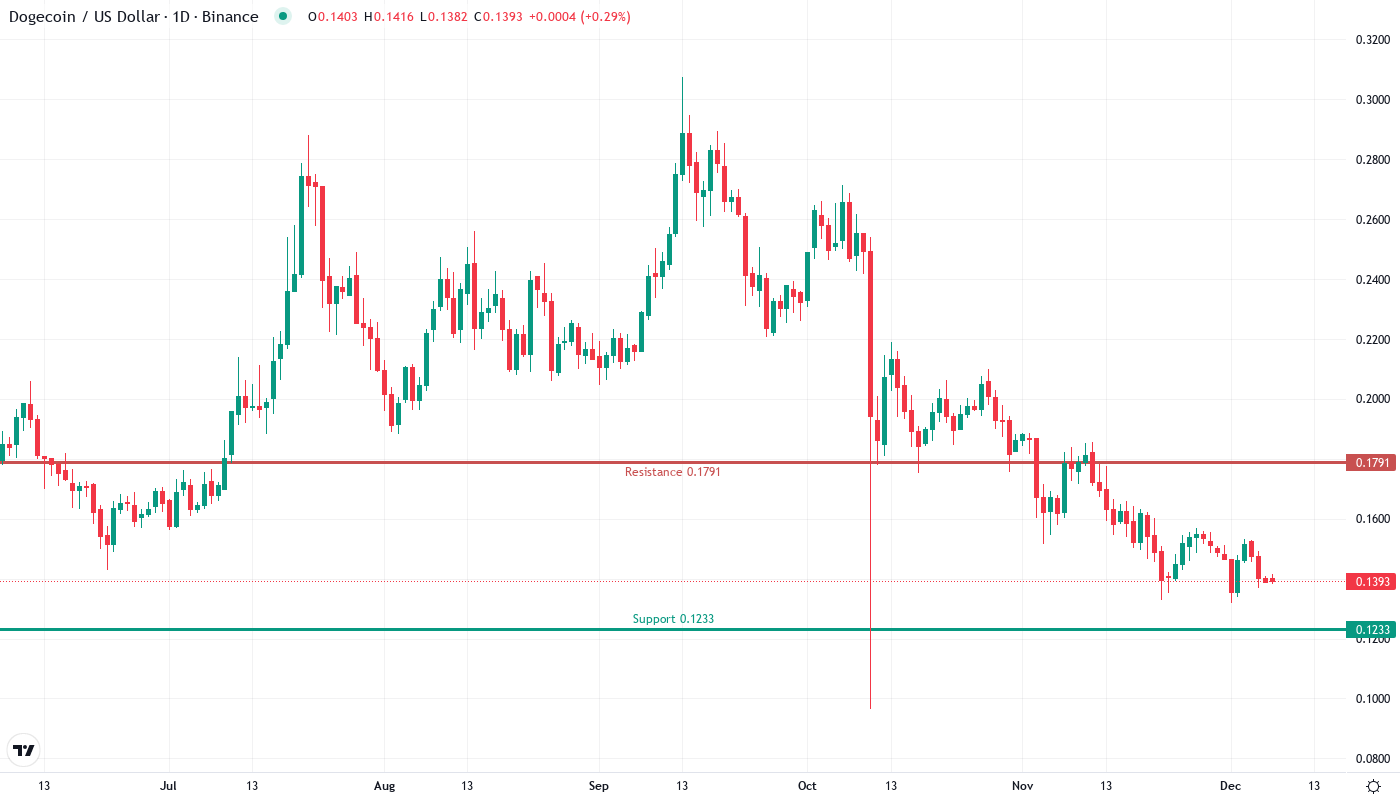
Dogecoin’s devastating drop to $0.1393 represents a 14.2% weekly collapse and a brutal 38.9% three-month decline, with the meme coin now trading at its lowest levels since the August washout. The plunge accelerated after DOGE lost critical support at $0.15, triggering stop-loss cascades that pushed price through multiple technical floors. Yet amid the carnage, whales accumulated 550 million tokens, suggesting smart money sees value at these beaten-down levels – especially with Buenos Aires approving DOGE for tax payments and technical patterns hinting at a potential reversal setup. The main question for traders is: can the $0.138 support level hold against continued selling pressure, or will bears push for a complete retest of summer lows?
| Metric | Value |
|---|---|
| Asset | DOGECOIN (DOGE) |
| Current Price | $0.14 |
| Weekly Performance | -6.01% |
| Monthly Performance | -14.22% |
| RSI (Relative Strength Index) | 38.8 |
| ADX (Average Directional Index) | 40.6 |
| MACD (MACD Level) | -0.01 |
| CCI (Commodity Channel Index, 20-period) | -97.59 |
Momentum Exhaustion Signals Capitulation Phase Near Completion
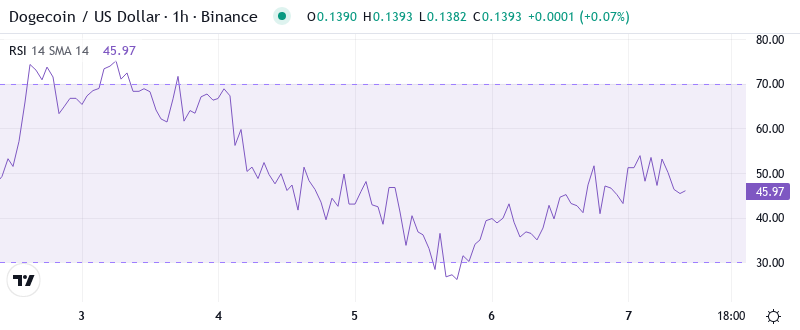
Reading the oscillator at 38.84 on the daily timeframe, traders see classic oversold conditions emerging for the first time since August’s market-wide crypto washout. The momentum indicator hasn’t touched these depressed levels in nearly six months, and historically, such extreme readings have marked significant local bottoms for DOGE. Similar RSI configurations in August preceded a 40% relief rally within two weeks, while the March oversold bounce delivered even more dramatic gains.
So for swing traders, this deeply oversold RSI suggests the selling exhaustion phase is approaching its terminus. The combination of whale accumulation at these levels and the Buenos Aires tax payment catalyst could provide the spark needed for mean reversion. However, momentum can remain oversold longer than traders expect, especially if broader crypto market sentiment stays risk-off.
ADX at 40.62 Reveals Mature Downtrend Nearing Exhaustion Point
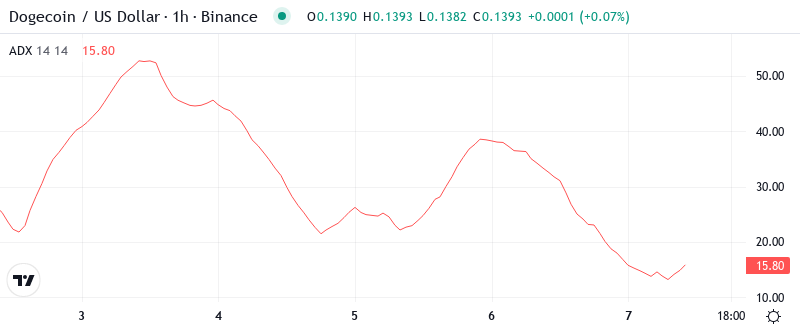
At the level of 40.62, the ADX entry indicates we’re witnessing one of the strongest trending moves in DOGE’s recent history – unfortunately for bulls, it’s pointing straight down. This extreme reading surpasses even the November flush and matches levels typically associated with climactic selling events. Basically, when ADX climbs above 40, it often signals that the prevailing trend has become overextended and ripe for at least a counter-trend bounce.
To clarify, the ADX is indicating that while bears have controlled price action with devastating efficiency, such powerful one-way moves rarely sustain indefinitely. Day traders should prepare for increased volatility as this mature downtrend shows signs of exhaustion. The whale accumulation of 550 million tokens precisely as ADX peaked above 40 suggests institutional players are positioning for the eventual reversal.
20-Day EMA at $0.149 Becomes First Resistance Target for Recovery
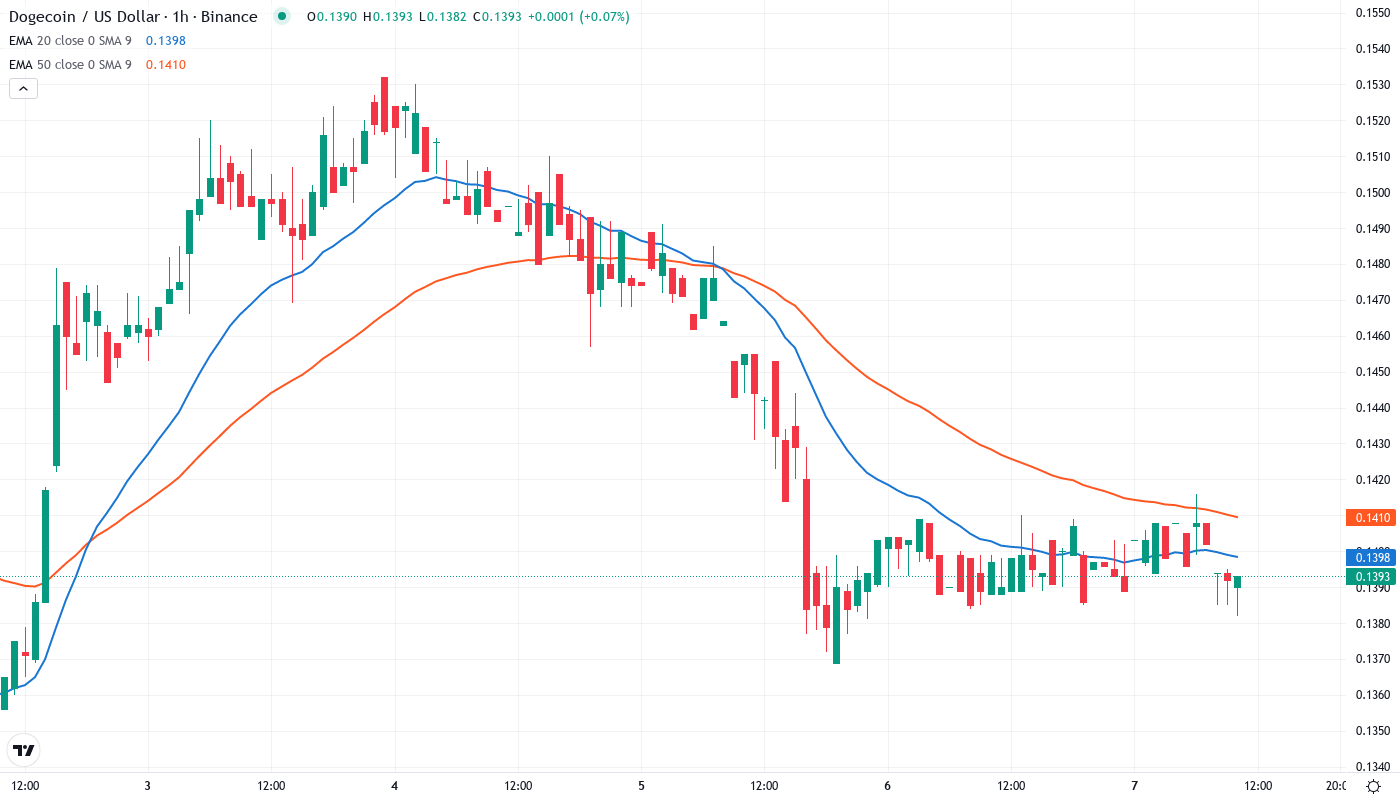
Price action through the EMA ribbons paints a sobering picture – DOGE currently trades below every single moving average from the 10-day ($0.144) through the 200-day ($0.199). The complete bearish alignment of these averages creates a formidable overhead resistance stack that bulls must reclaim incrementally. Most immediately, the 20-day EMA at $0.149 looms as the first major hurdle, having rejected three separate recovery attempts since early December.
What’s particularly revealing is how the 50-day EMA at $0.167 transformed from reliable support throughout October and November into stubborn resistance after the breakdown. This level now represents the key inflection point – any sustained move above it would signal a potential trend reversal, especially given the inverse head and shoulders pattern forming on longer timeframes. The Buenos Aires adoption news could provide fundamental backing for such a technical recovery.
Support at $0.138 Tested for Sixth Time as Whales Defend the Line
Bulls are desperately defending the $0.138 support zone that’s been tested six times over the past three months, with each bounce growing progressively weaker until this week’s whale intervention. The 550 million token accumulation occurred precisely as price touched this level, suggesting large players view it as a line in the sand. Below this, the next meaningful support doesn’t emerge until the August lows near $0.123, leaving an uncomfortable air pocket that could accelerate losses.
Resistance stacks heavy from current levels through $0.157, where December’s breakdown point coincides with the monthly pivot. The $0.144-$0.149 zone presents the most immediate challenge, clustering the 10 and 20-day EMAs with horizontal resistance from recent failed rallies. Any attempt to reclaim higher ground must first conquer this congestion zone, which has repelled buyers three times in two weeks.
The market structure reveals a clear descending triangle pattern with support at $0.138 holding firm while resistance slopes lower from $0.185 to current levels. This compression typically resolves with a violent move in either direction – the inverse H&S pattern identified by analysts targets $0.40 on a successful breakout, while failure here could see a swift descent toward $0.10. The Buenos Aires tax payment adoption adds a fundamental catalyst that could tip the scales toward the bullish resolution.
Recovery Requires Decisive Close Above $0.149 to Shift Momentum
Bulls must engineer a convincing daily close above the 20-day EMA at $0.149 to signal any genuine recovery attempt. Such a move would flip the first key moving average from resistance to support while potentially triggering short covering from aggressive bears. The combination of oversold RSI, exhausted ADX readings, and whale accumulation provides the technical setup, while the Buenos Aires adoption news offers the fundamental catalyst to fuel a relief rally toward $0.167.
The bearish scenario unfolds if $0.138 support crumbles under sustained selling pressure. Loss of this critical level would trap recent bottom-fishers and likely cascade into the $0.123 August low zone, potentially opening the door to sub-$0.10 prices not seen since early 2024. Volume on any breakdown would confirm whether this represents capitulation or merely another leg lower in the broader correction.
Given the extreme oversold conditions, mature downtrend exhaustion signals, and significant whale accumulation at support, the most probable near-term outcome sees DOGE staging a relief bounce toward the $0.149-$0.157 resistance cluster before the larger trend reasserts itself. The positive adoption developments could extend any recovery attempt, but bulls need sustained buying pressure to escape the descending triangle pattern that’s compressed price action for the past month.