Dogecoin Tests Critical Support as Whales Accumulate 550 Million Tokens

Market Pulse
- DOGE trades at $0.1386, down 14.7% monthly but holding above crucial $0.138 support where whales accumulated 550 million tokens
- Inverse head-and-shoulders pattern targets $0.40 if current support maintains, matching descending triangle projections
- Buenos Aires crypto tax payment approval adds fundamental catalyst as technical setup coils for decisive move
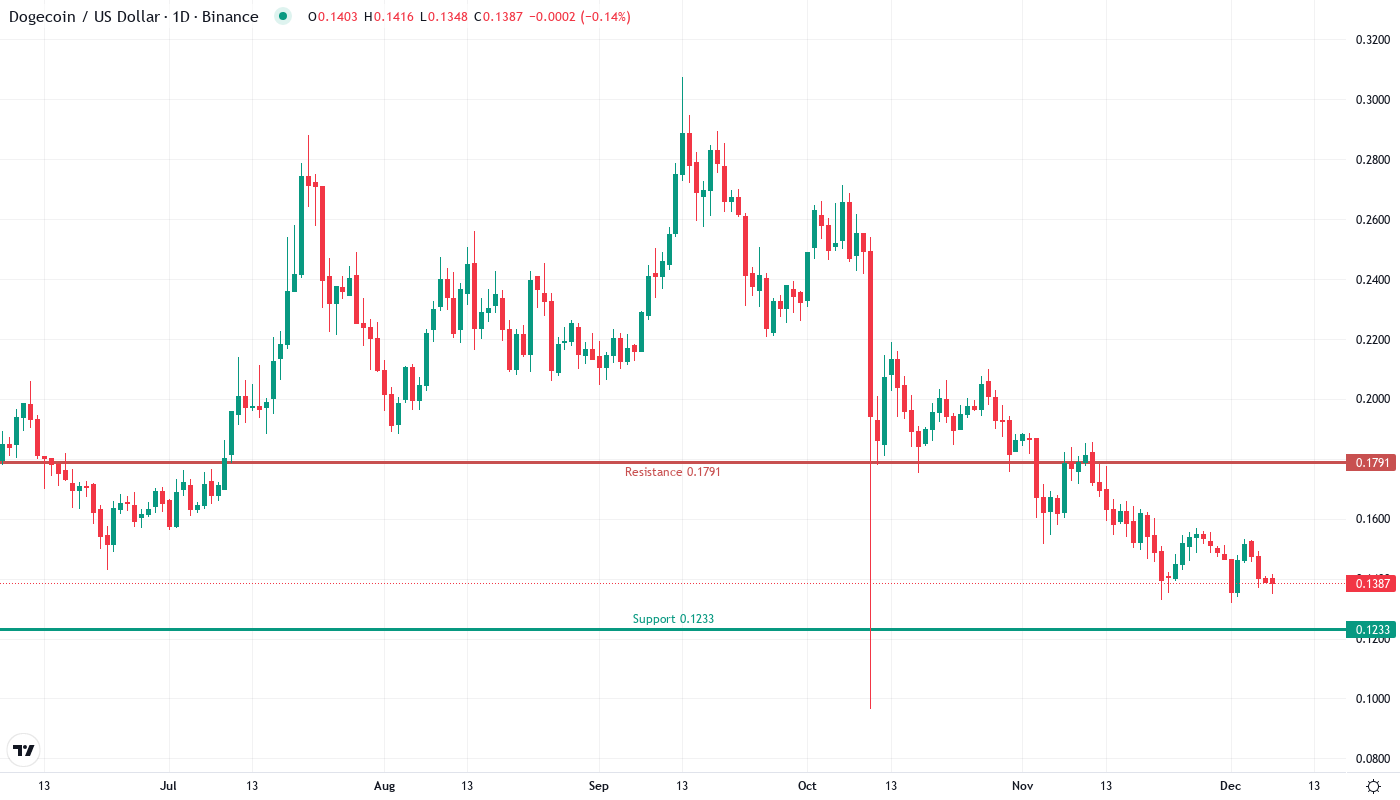
Dogecoin navigates a critical juncture at $0.1386, having shed 14.7% over the past month while clinging to support that attracted significant whale accumulation. The meme coin’s 550 million token buying spree by large holders coincided with tests of the $0.138 level, creating a confluence of technical and on-chain signals that suggest this zone carries weight. With Buenos Aires approving DOGE for tax payments and multiple bullish chart patterns converging, the setup presents clear triggers in both directions. The main question for traders is: will the combination of whale support and real-world adoption catalysts be enough to validate the inverse head-and-shoulders pattern targeting $0.40?
| Metric | Value |
|---|---|
| Asset | DOGECOIN (DOGE) |
| Current Price | $0.14 |
| Weekly Performance | -6.48% |
| Monthly Performance | -14.66% |
| RSI (Relative Strength Index) | 38.3 |
| ADX (Average Directional Index) | 41.0 |
| MACD (MACD Level) | -0.01 |
| CCI (Commodity Channel Index, 20-period) | -112.40 |
RSI at 38.3 Approaches Oversold Territory After Month-Long Slide
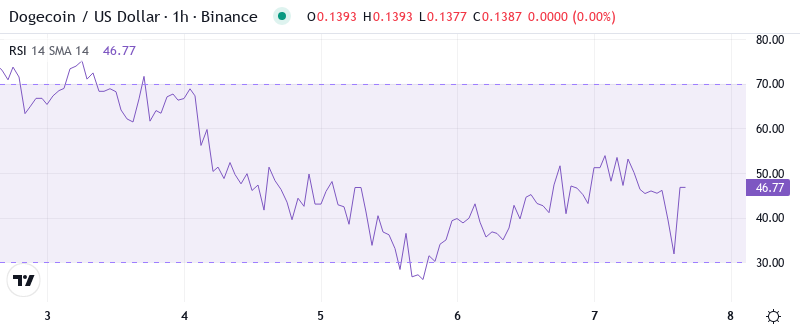
Reading the oscillator at 38.3 on the daily timeframe, traders see momentum approaching oversold conditions without quite reaching capitulation levels. This positioning mirrors setups from previous accumulation phases where smart money stepped in before RSI hit the traditional 30 floor. The weekly RSI holds steadier at 37.7, suggesting the longer timeframe hasn’t fully washed out despite the monthly decline.
What’s revealing is how RSI behaved during the recent whale accumulation – it stabilized in this 35-40 range rather than continuing lower. Similar RSI configurations in August preceded a 35% relief rally, though that move came from deeper oversold readings near 30. So for swing traders, this balanced-yet-weak RSI means entries could come either at current levels with tight stops below $0.138, or on a final flush toward RSI 30 if support breaks.
ADX at 41 Signals Mature Downtrend Nearing Exhaustion
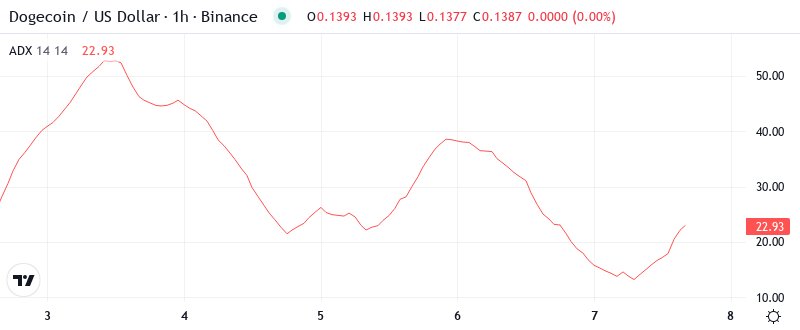
ADX reads 41.0, marking an extended trending phase that typically doesn’t sustain much longer without consolidation or reversal. At this level, the ADX indicates that the current downtrend has run with conviction but approaches historical exhaustion zones. Basically, when ADX climbs above 40, markets often need to digest the move through sideways action or sharp reversals.
Looking at prior instances where DOGE’s ADX exceeded 40, the outcomes split between V-shaped recoveries and extended consolidation periods. The key difference this time is the fundamental backdrop – Buenos Aires tax payment adoption and whale accumulation suggest buyers are positioning for the next leg rather than abandoning ship. Therefore, day traders should prepare for increased volatility as this mature trend reaches its natural limits, with quick scalps favored over directional swings until ADX drops below 25.
20-Day EMA at $0.155 Caps Recovery Attempts While 50-Day Provides Distant Resistance
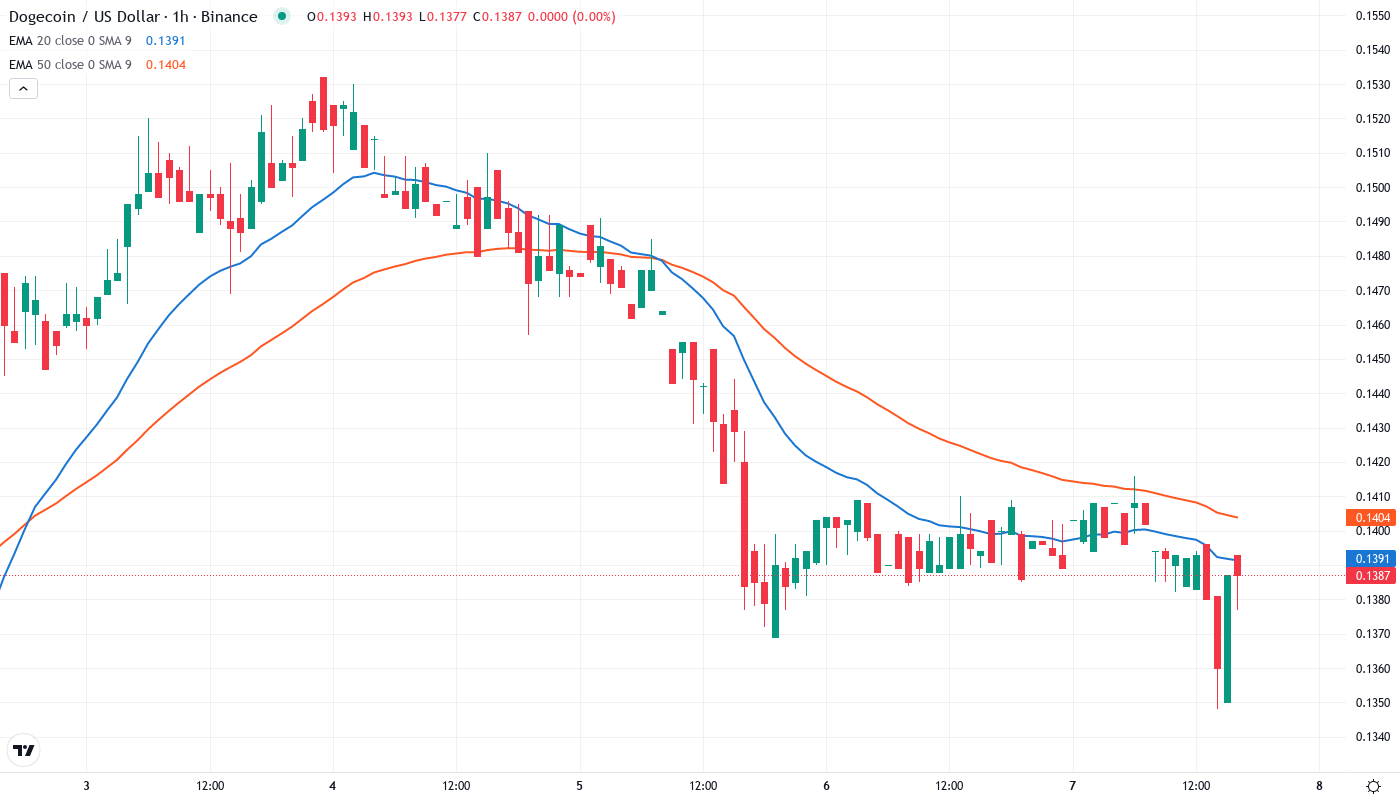
Price action tells a clear story through the EMA structure – DOGE trades well below all major moving averages, with the 10-day EMA at $0.144 providing immediate overhead resistance. More importantly, the 20-day EMA at $0.155 rejected the last two recovery attempts, establishing itself as the key level bulls need to reclaim. The 50-day EMA sits considerably higher at $0.167, creating multiple resistance layers that make any sustained recovery a challenging endeavor.
Crucially, the compression between current price ($0.1386) and the 10-day EMA ($0.144) leaves minimal room for error. This tight spacing often precedes explosive moves as trapped positions unwind in either direction. The setup resembles a coiled spring where the first group to lose patience could trigger a cascade – bulls capitulating below $0.138 would target $0.123 support, while bears covering above $0.144 could squeeze price toward the 20-day EMA at $0.155.
$0.138 Support Becomes Line in Sand After 550 Million Token Accumulation
The immediate resistance clusters between $0.144 (10-day EMA) and $0.155 (20-day EMA), with December’s breakdown point at $0.157 adding another layer of selling pressure. These levels align with the monthly pivot R1 at $0.156, creating a formidable barrier for any recovery attempt. The descending triangle pattern everyone’s watching places its upper boundary near $0.165, which coincidentally matches the 50-day EMA zone.
Support architecture looks more robust thanks to whale accumulation at $0.138, transforming what was merely a technical level into a fundamentally-backed floor. Below this crucial support, the monthly pivot at $0.123 offers the next safety net, followed by the yearly low near $0.117. The inverse head-and-shoulders pattern that targets $0.40 only remains valid above $0.138 – lose this level and the entire bullish thesis crumbles.
More telling is the volume profile during recent tests of $0.138 support – each touch brought increasing accumulation rather than distribution, suggesting institutional money views these levels as attractive entry points. The combination of technical patterns (descending triangle, inverse H&S) with fundamental catalysts (Buenos Aires adoption, ETF speculation) creates a powder keg scenario where the next directional break could be violent.
Bulls Must Reclaim $0.155 to Validate Reversal Pattern
Bulls require a decisive close above the 20-day EMA at $0.155 to confirm the inverse head-and-shoulders pattern remains in play. Such a move would not only break the immediate resistance cluster but also shift the market structure bullish for the first time since December’s collapse. The measured move to $0.40 needs sustained buying above $0.165 to activate, with the Buenos Aires tax payment catalyst potentially providing the narrative fuel for such a rally.
The bearish scenario triggers if whales abandon their defense of $0.138 support, opening an air pocket toward $0.123 and potentially $0.117. A volume spike below $0.138 would trap recent accumulators and likely cascade into the monthly pivot S1 at $0.098, invalidating all bullish patterns. This outcome becomes more probable if broader crypto markets turn risk-off or if the meme coin sector rotation continues elsewhere.
Given the mature downtrend (ADX above 40), whale accumulation at support, and converging pattern triggers, the most likely near-term path is a volatile consolidation between $0.138 and $0.155 before the next trending move emerges. The fundamental catalysts favor an eventual upside resolution, but technicals suggest more base-building is needed first.