Dogecoin Tests Critical $0.17 Support as ETF Speculation Heats Up Market Sentiment

Market Pulse
DOGE accumulates around the six-time tested support at $0.1716 as ETF filing momentum gains power.A series of technical patterns indicate th
e bullish reversal structure with the measured targets above $0.21.
Thanks to the ADX reading, it is now possible to understand the prevailing strength of the trend as the volatility phase is over.
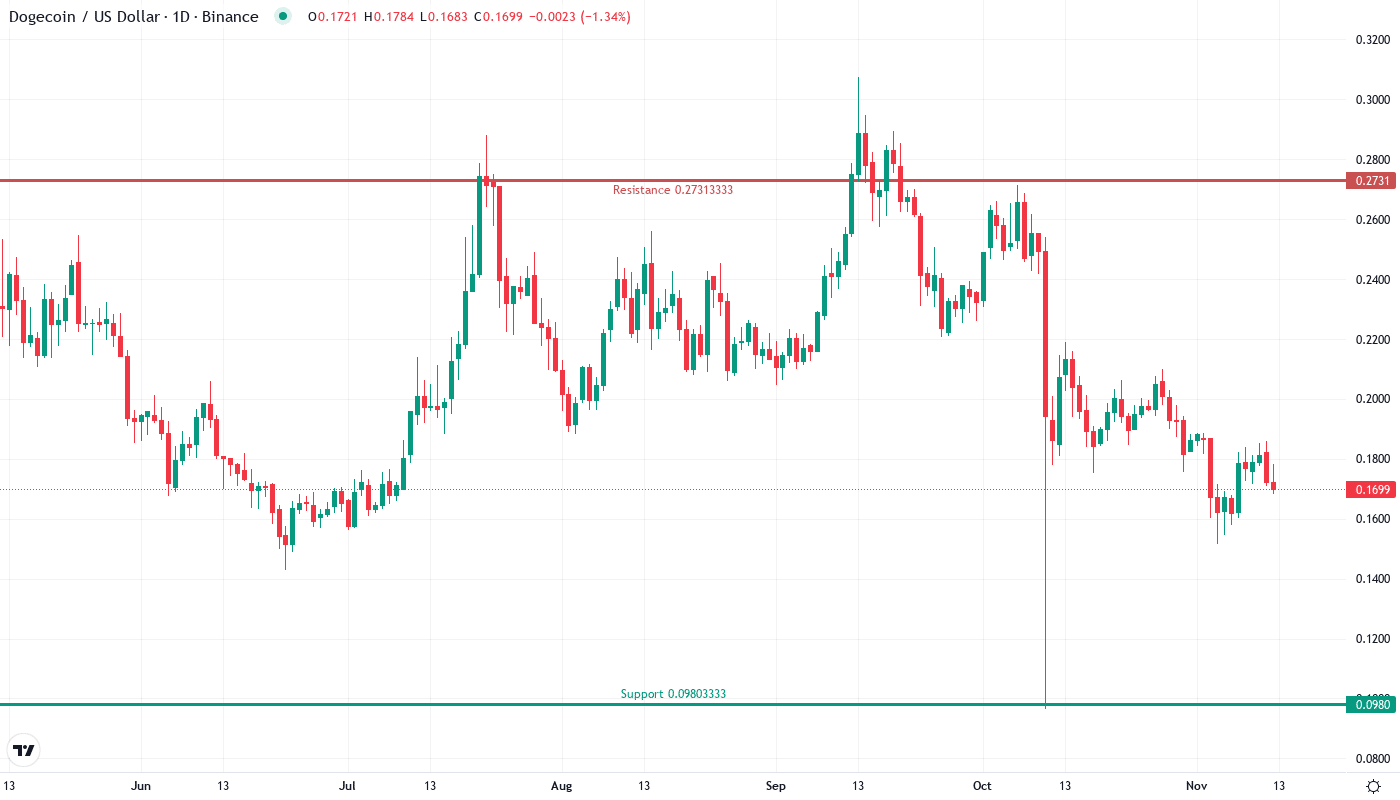
The fluctuations in the price of Dogecoin are a clear sign that the market has reached a turning point, and the meme coin has been available for trading at $0.1687 after a drop of 18.97% from a recent peak close to $0.21 per week. The Bitwise ETF filing has just been the thing that has created a new wave of interest in institutional investment in DOGE. At the same time, the price is testing a very important support zone for the sixth time already and it has not been broken since the summer. The key question for traders now is whether this historically reliable support price at $0.1716 is going to push for another rally or the total market correction at last has leaked to the retail market negatively affecting the buyers’ confidence?
| Metric | Value |
|---|---|
| Asset | DOGECOIN (DOGE) |
| Current Price | $0.17 |
| Weekly Performance | 3.69% |
| Monthly Performance | -18.97% |
| RSI (Relative Strength Index) | 39.3 |
| ADX (Average Directional Index) | 37.2 |
| MACD (MACD Level) | -0.01 |
| CCI (Commodity Channel Index, 20-period) | -66.69 |
RSI Momentum Shifts Signal Accumulation Phase
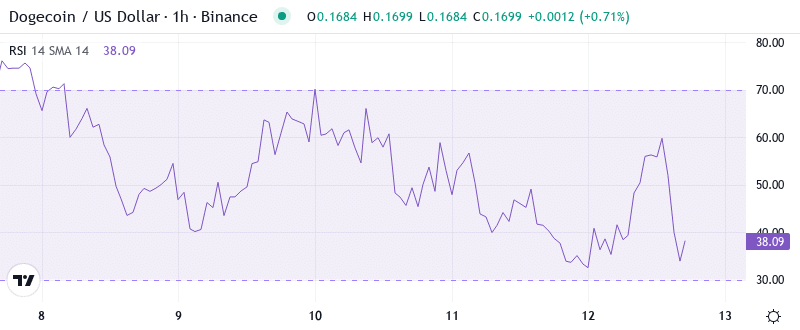
At present, the RSI index indicates a drop to 39.32 in the daily timeframe which is in the oversold area for the first time since the August washout. This momentum exhaustion often indicates capitulation periods when weak ones leave the table and smart players are able to collect. The weekly RSI is more stable and remains at 41.89, indicating that the macro trend structure remains unaltered despite temporary pressures.
It is right to see the past as a teacher in this regard – RSI setups seen in the past have had nearly the same impact on the market. Buying was one of the most profitable trades when the ETF shifted handedly to the green. The main focus now should be if RSI offers a retest of the previous peak at 35, and it stays higher than 35, thus confirming that sellers are out of breath.
ADX Reveals Trend Strength Building Beneath Surface
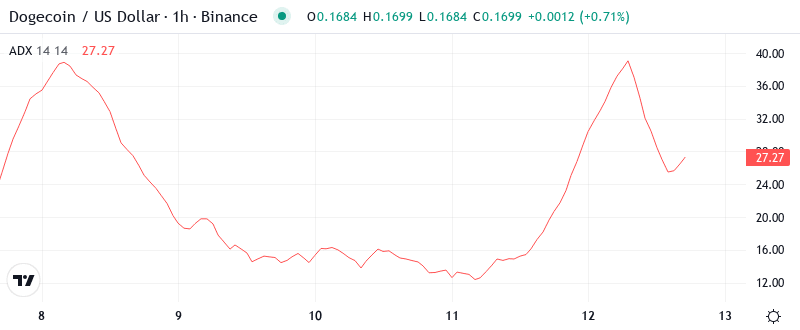
The ADX reading at 37.20 marks a shift from the erratic consolidation phase to the directional movement stage. This point argues that the trend,u00a0which is on the rise, has the power to drive the next sustained move, but the route is still undecided. To put it simply, the market is like a spring coiling, which with time, accumulated energy will be released in any direction.
The crossover dynamics suggest resolution timing. Since the ADX has been rising from the mid-20s last week, the momentum traders need to psych themselves up for an upcoming wave of increased volatility and clearer directional bias. The steadfast phase that had confused both bulls and bears seems to be ready to break. Day traders ought to modify their strategies- the range mean reversion approach that had been effective doing the low ADX readings under 25 would have likely seen the opposite when the trending conditions were supported again.
Moving Average Confluence Creates Decision Zone
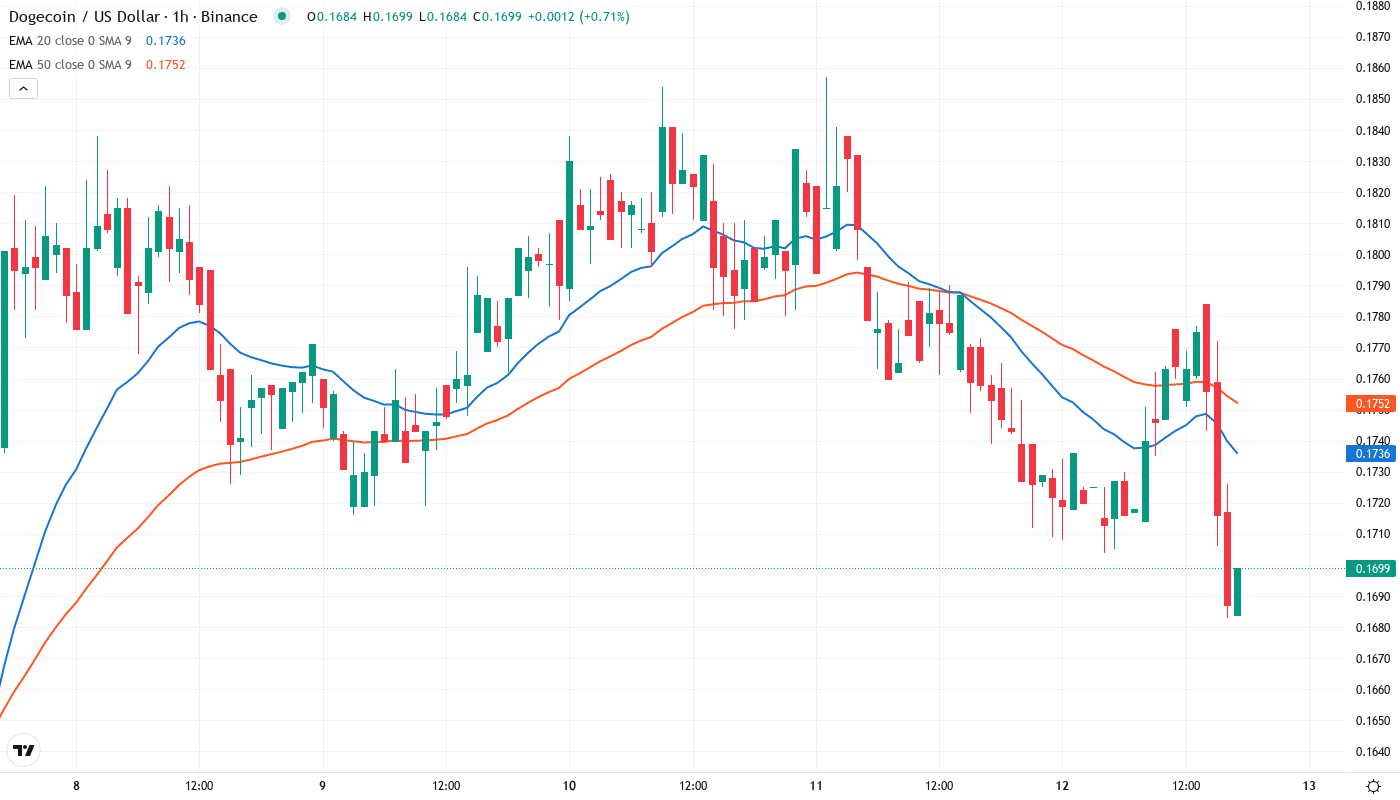
Price actions are dangling below the whole EMA ribbon, and DOGE is trading under the 10-day ($0.1754), 20-day ($0.1817), and most importantly, the 50-day EMA at $0.1990. The combined overhead resistance is really a feeling of sold-out, which would be the form of support bulls require to reverse the concentration. The 200-day EMA stays high at $0.2089 and determines the ultimate trend.
One of the highlights is the right combination of the 50-day EMA and the psychological $0.20 level with the inverse head-and-shoulders neckline that traders follow. This triple confluence at $0.199-0.201 turns that area into the key battlefield. A determined close above that level would shift the intermediate trend to bullish and could cause automated trading to kick in. Before this, the EMA cloud plays the role of dynamic resistance limiting the upward moves.
Support and Resistance Define the Battleground
The directly opposition points collocate between $0.181-0.188, where the 10 and 20-day EMAs meet with the monthly pivot point. This zone resisted three different rally attempts in the last week, to construct it as the first obstacle for any recovery bounce. Furst, the most crucial is at the $0.199-0.201 region, which is the make-or-break level due to its technical coherence.
The $0.1716 level has demonstrated its reliability as a support structure, making it look even more constructive. This level has appreciated on the rising support trendline that is still active since it has repeatedly captured every swing low since June. The base of the cup-and-handle formation also provides further technical confirmation, which is nearby $0.165. The monthly S1 pivot at $0.142 below it is the only level left to hold the line against a larger drop toward $0.10.
It is the favorable condition for the buyer market under the circumstance that $0.1716 is sustained during any retest. The continuous rebound from this level indicates the institutional buying, meanwhile, the ETF speculation suggests the fundamental cause for the next rise after the technical resistance is overcome.
Trading the Resolution
The close of the days the Bulls require over $0.188 to bear the immediate selling pressure. Afterward, they can aim for the essential $0.20-0.201 resistance zone. The cup-with-handle designs indicate the $0.211 level as a possible target if the breakout is confirmed while the inverse head-shoulders specifications place it at $0.235. The issuance of the ETF based on speculation may be the initial step from which this upward path will return.
The situation becomes more bearish if the support level at $0.1716 is breached due to volume, which will potentially lead to stops down to $0.142. Breaking below the lows of August at about $0.135 would also not only negate the positive pattern but also indicate a deeper decline toward $0.10. The likelihood of this event increases if the overall cryptocurrency market stays depressed.
Taking into account the technical configuration and the basic changes, the most probable scenario will witness DOGE lying between $0.165-0.188 before it tries to push the $0.20 resistance again as ETF momentum gathers through the beginning of 2025.