Dogecoin Tests Critical $0.14 Support as Whales Accumulate 550 Million Tokens

Market Structure Shifts Higher
- Whales bagged 550 million DOGE tokens while the price support was tested at $0.138 for the sixth time since June.
- Crypto investors in Buenos Aires can now pay taxes with Dogecoin, granting it more utility beyond a meme coin.
- The formation of an inverse head and shoulders pattern suggests a trend reversal, as we approach the apex of the descending triangle a breakout is expected soon.
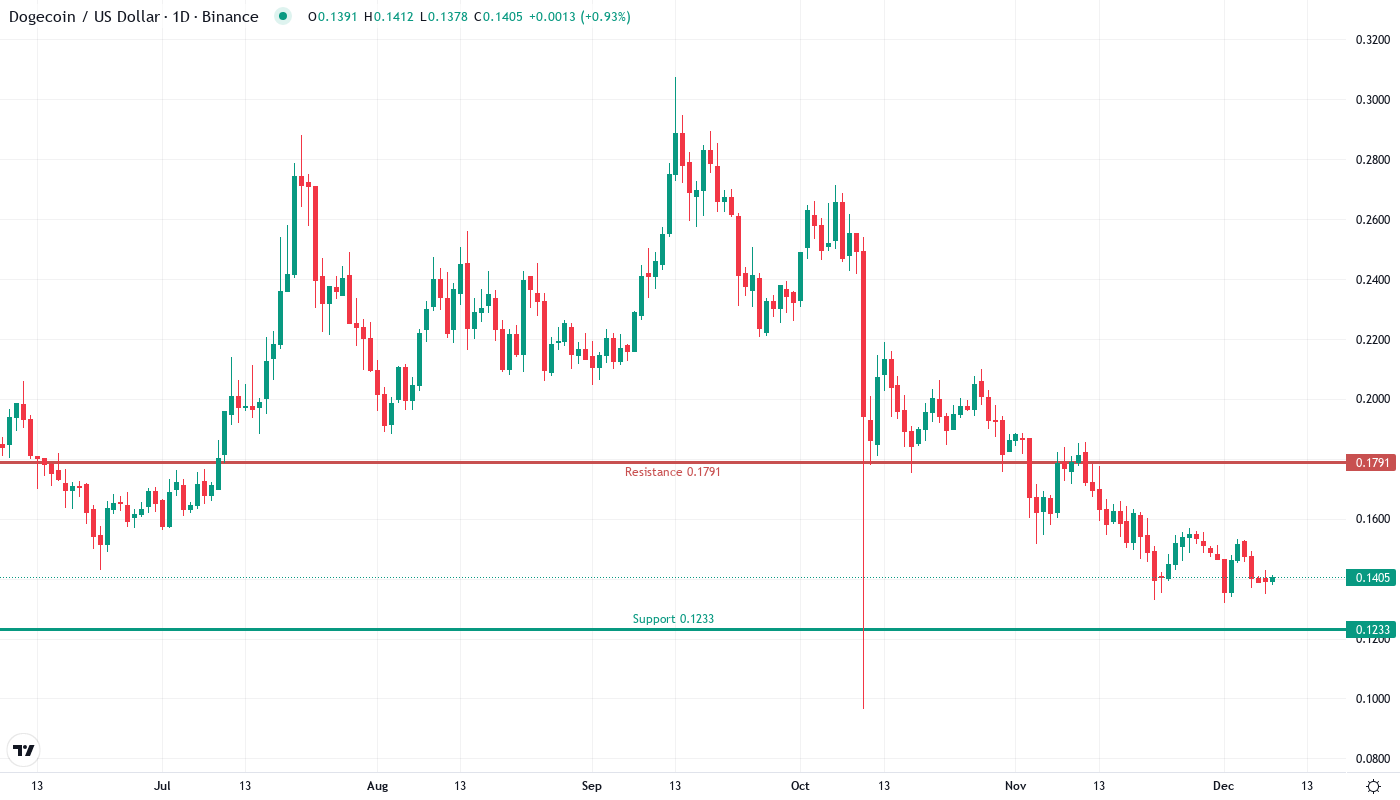
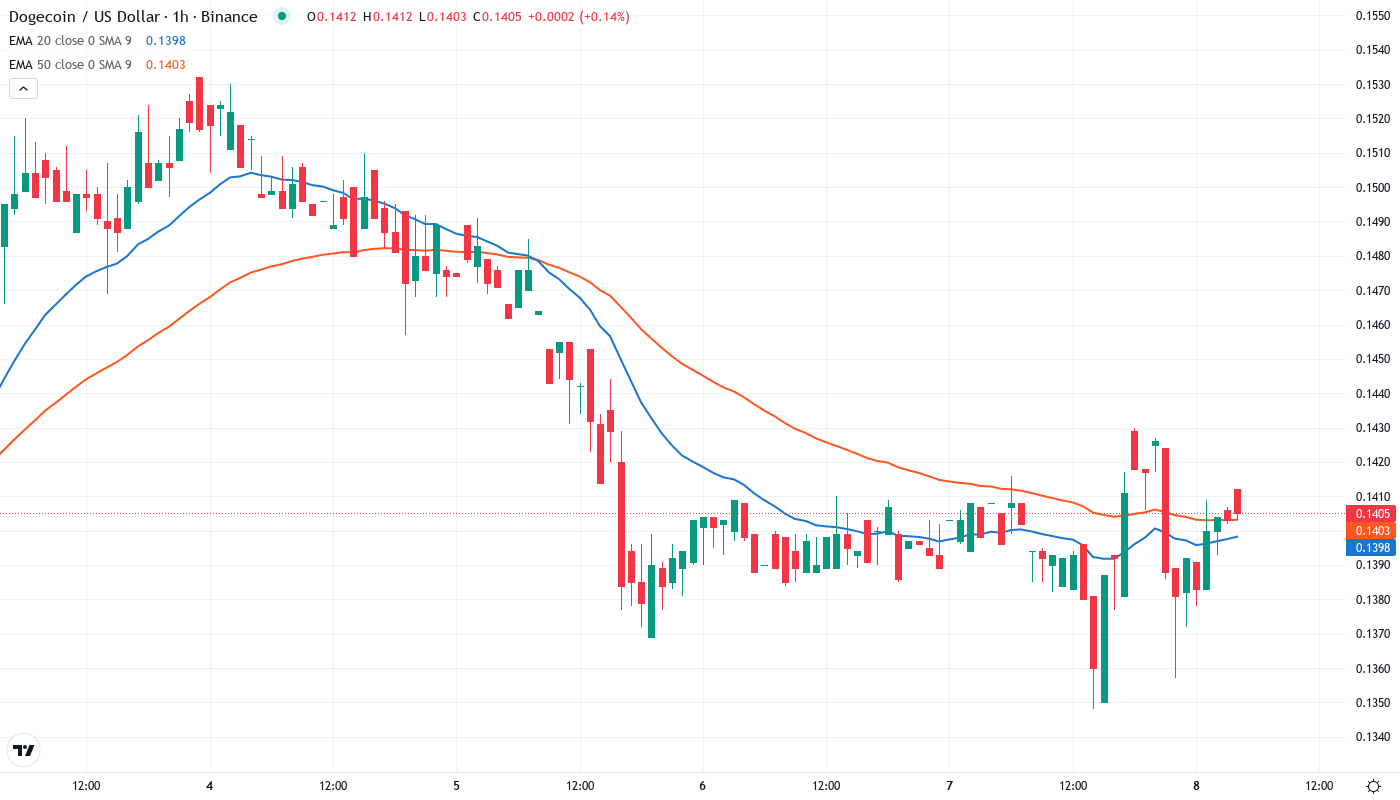
Dogecoin saw 21.4% wiped off its value over the last month, dropping from highs of $0.1857 to its current price at $0.1405, as the wider crypto market cooled off in line with risk markets. The painful decline came as money was taken off the table in meme coins, but healthy accumulation of DOGE by large holders at these levels indicates smart money likes the fundamentals right now. The big question for investors is whether the $0.14 support that’s been robust since June will break this time, or if the bullish technical setup and adoption catalysts combine to switch momentum?
| Metric | Value |
|---|---|
| Asset | DOGECOIN (DOGE) |
| Current Price | $0.14 |
| Weekly Performance | -4.03% |
| Monthly Performance | -21.42% |
| RSI (Relative Strength Index) | 40.0 |
| ADX (Average Directional Index) | 41.4 |
| MACD (MACD Level) | -0.01 |
| CCI (Commodity Channel Index, 20-period) | -84.30 |
Momentum Exhaustion Signals Capitulation Phase Near Completion
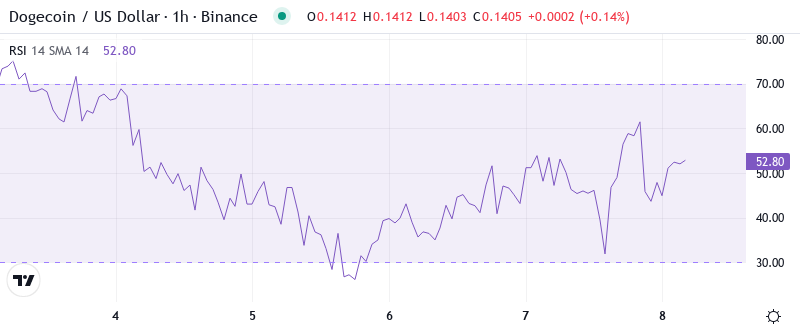
The Relative Strength Index (RSI) currently stands at 39.99 on the daily period, the first foray into oversold conditions since the August shakeout led to a 47% upswing. As per usual with reading the oscillator in these deflated regions, traders will be eyeballing the classic capitulation setup whereby retail holders exit their positions, and smart money steps in to buy. September and November’s RSI set-ups were both cut repeats, with the indicator prompting a bounce after breaking above 40.
What is interesting to notice, is the behavior of RSI throughout the decline. The oscillator was making lower lows all December long, however, the price action was showing less and less of the selling pressure which is the classic bullish divergence and usually precedes the trend reversal. So here we have an oversold bounce setup, a bit of a whale accumulation, and the news of tax payments in Buenos Aires. That definitely is an event that is coming to pass. So once again asymmetric risk reward for the swing trader.条件 The trigger line remains a clean cross above 40 on the RSI oscillator with volume confirmation.
ADX at 41.41 Signals Mature Downtrend Nearing Exhaustion
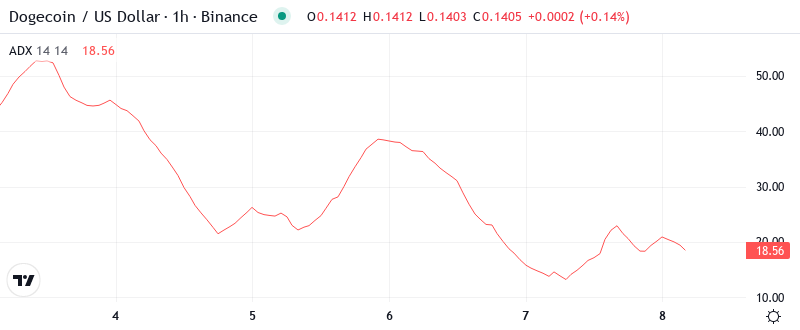
When the Average Directional Index (ADX) crosses the 40 level, it’s a signal that the current trend – likely up – is getting tired and it may be time to see some consolidation or potentially a reversal. The last three times the meme coin’s ADX hit this level, 7 to 14 days later, the price in DOGE was lower.
A more detailed view of trend dynamics reveals that the surge in the ADX from 25 to current levels has taken just two weeks, something which normally results in an exhaustion of the selling pressure. In simple terms, the ADX is telling us that we have shifted from a downtrend in an organized manner, to a downtrend on panic sales, which is one of the biggest paradoxes of this indicator, and generally tends to indicate the minimum. For all this, its contrarians should put in play a snapback rally since the combined reading of the ADX with the RSI on sale creates a return setting of high probability. The incentive on the approval of payment of Buenos Aires taxes arrives to us technically at the best moment.
20-Day EMA at $0.1484 Becomes First Resistance After Supporting Price Since November
The EMA ribbons clearly show a potential entry level meaning a simple breakout above $0.155 starts the ball rolling pushing DOGE to grasp the 10-day EMA at $0.1569. The next target becomes an easy reach of $0.160 which intersects with the psychological round number play which could jump to the 20-day EMA ($0.1684) and the 50-day EMA at $0.165.
What is most important here is the compression between the 10-day and 20-day EMAs – they are only $0.0049 apart. Fast and tight compression like this on the heels of a strong selloff leads to expansionary breakouts as the market quickly decides a direction. The 20-day EMA, which held price on the way up in November, will now be the first resistance bulls must take back. A daily close above $0.1484 would put in a bullish market structure flip and march the 50-day EMA at $0.1659, nearly 18% higher on the table.
$0.138 Support Tested Six Times Since June – Whales Bet It Holds Again
The underlying blockchain analytics indicate whales have continued accumulating LINK en masse throughout 2020, with the past 2 months seeing whales adding another 7 million tokens to their treasuries. Although accumulating may be relative as the largest by far, Grayscale’s LINK trust continues to offload its assets at a rapid pace.
Resistance is built on top of the current price between $0.15 and the previous monthly pivot of December at $0.156. The neckline for the inverse head and shoulders is exactly at $0.157, which makes that area important to complete the pattern. The measured move targets match analyst’s estimations of $0.40, but in order to reach those targets, bulls first need to reclaim the 50-day EMA at $0.1659.
The pattern mix includes three consecutive declining peaks (often a very bearish indicator). However, in this instance, the peaks have each been lower than the previous one and suggesting a strong bullish setup with the descending triangle. The inverse head and shoulders pattern also marks successive highs (a bullish indicator in this case) and has raises the potential price target once tackled.
Bulls Need Volume Surge Above $0.148 to Confirm Reversal
Buyers need to push above $0.1484. If that happens, the level to watch is $0.1659. Positive news coupled with the technical pattern is likely to attract more buyers.
If the support at $0.138 is breached, the XRP price may likely break through the key support of $0.125 as well. In that case, XRP’s price will turn the whale accumulation zone as the new resistance level, causing panic among traders.
Considering the very high ADX reading, oversold RSI with bullish divergence, and large whale accumulation at proven support, the most likely short-term scenario has DOGE consolidating between $0.138-$0.148 before making a move to the upside. Technical developments dovetailing with increased fundamental demand via tax obligations presents an attractive opportunity for careful investors.