Dogecoin Drops to Four-Month Low as RSI Signals Capitulation
Market Pulse
- DOGE tumbles to $0.161, erasing over 31% in the past month despite whale accumulation
- RSI plunges to 37.8, matching oversold conditions last seen during summer washouts
- ADX at 38.3 confirms bears control the trend with increasing directional strength

Dogecoin has shed 18% over the past week and nearly 32% for the month, sliding to $0.161 as selling pressure overwhelms the recent whale accumulation of 4.72 billion DOGE. The memecoin now trades at its lowest level since early August, with technical indicators painting an increasingly bearish picture despite institutional interest through new ETF listings. The main question for traders is: will the oversold bounce materialize near current levels, or does DOGE need to test deeper support around $0.14 before finding a floor?
| Metric | Value |
|---|---|
| Asset | DOGECOIN (DOGE) |
| Current Price | $0.16 |
| Weekly Performance | -10.01% |
| Monthly Performance | -17.99% |
| RSI (Relative Strength Index) | 36.8 |
| ADX (Average Directional Index) | 38.3 |
| MACD (MACD Level) | -0.01 |
| CCI (Commodity Channel Index, 20-period) | -103.75 |
Momentum Exhaustion Signals Capitulation Phase Complete
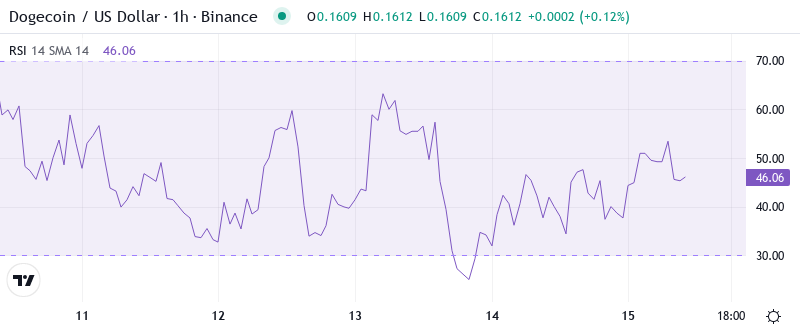
RSI sits at 37.8 on the daily timeframe, marking the first genuine oversold reading since the August washout that preceded a 40% relief rally. What’s particularly telling is how quickly momentum collapsed from neutral territory just two weeks ago, suggesting the selling has been both aggressive and sustained. The velocity of this decline mirrors previous capitulation events in DOGE’s price history.
Similar RSI configurations below 40 have historically marked intermediate bottoms for Dogecoin, though timing the exact reversal remains challenging. So for swing traders, this oversold RSI creates a high-risk, high-reward setup where any positive catalyst – like the continued whale accumulation or ETF inclusion benefits – could spark a sharp snapback rally. That said, oversold can remain oversold in strong downtrends, making patience essential.
ADX at 38.3 Confirms Mature Downtrend Nearing Exhaustion
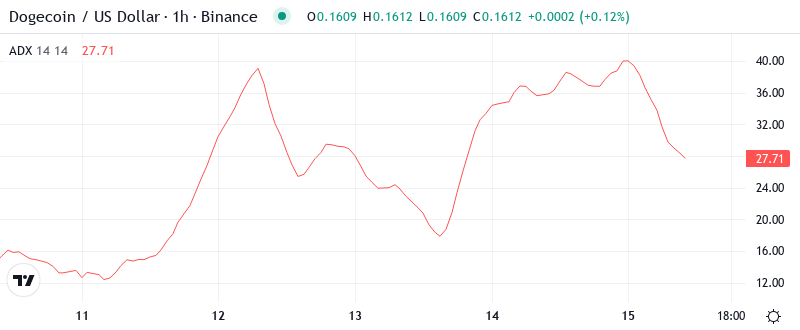
Looking at trend strength, the ADX reading of 38.3 indicates we’re dealing with a powerful directional move rather than choppy consolidation. Basically, when ADX climbs above 35, it signals conviction behind the prevailing trend – in this case, the bearish momentum that’s dominated December trading. The good news for bulls is that such elevated ADX levels often precede trend exhaustion.
At the level of 38.3, the ADX entry indicates that while sellers maintain control, we’re approaching the zone where downtrends typically lose steam. To clarify, readings above 40 often mark the final capitulation phase before a reversal or at least a meaningful bounce. Therefore, day traders should prepare for increased volatility as this mature trend approaches potential inflection points, especially given the whale accumulation providing a fundamental counternarrative to the technical weakness.
20-Day EMA at $0.178 Now Caps Rally Attempts
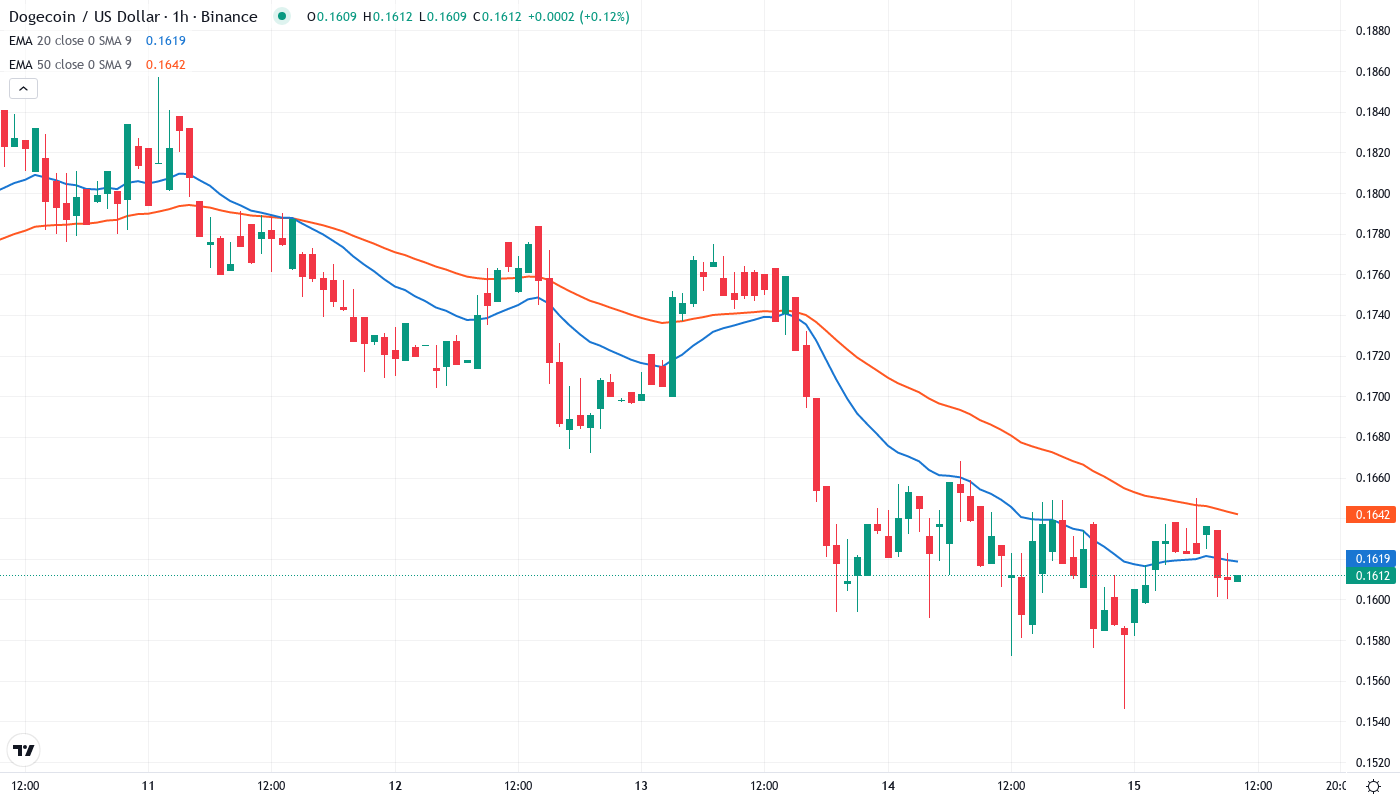
Price action through the EMA ribbons tells a clear story of deterioration. DOGE currently trades well below all major moving averages, with the 10-day EMA at $0.169, the 20-day at $0.178, and the critical 50-day EMA sitting way up at $0.195. This complete breakdown of moving average support occurred despite the positive news flow around ETF inclusions, showing technical forces currently trump fundamentals.
What’s most significant is how the 20-day EMA flipped from support to resistance after DOGE failed to hold above it during last week’s relief attempt. That former support at $0.178 now becomes the first major hurdle for any recovery bounce, followed by the psychological $0.20 level near the 50-day EMA. The bearish alignment of all short-term averages below longer-term ones reinforces the downtrend structure.
Support Crumbles as $0.161 Becomes Last Line of Defense
Resistance stacks heavy overhead, with the immediate ceiling at $0.178 (20-day EMA) followed by the more formidable barrier at $0.195 where the 50-day EMA converges with the psychological $0.20 round number. Above that, the monthly pivot at $0.273 seems like a distant memory, requiring a 70% rally just to revisit. The failed attempts to reclaim even the nearest resistance despite whale buying activity demonstrates how technically damaged DOGE has become.
Bulls desperately defend the current $0.161 level, which represents both today’s price and the weekly low – suggesting this area has attracted some dip-buying interest. However, the next meaningful support doesn’t arrive until the August lows near $0.142, leaving an air pocket of roughly 12% below current levels. The psychological $0.15 level might provide temporary support, but it lacks historical significance.
This structure reveals a market where sellers maintain control as long as DOGE stays below $0.178. The growing disconnect between positive fundamental developments (whale accumulation, ETF inclusion) and negative price action suggests technical forces are driving the narrative. Until buyers can reclaim and hold above the 20-day EMA, the path of least resistance remains lower.
Bears Target $0.142 as Bulls Need Miracle Close Above $0.178
Bulls require a decisive close above $0.178 to neutralize the immediate bearish pressure and open the door for a relief rally toward $0.195-$0.20. Given the oversold RSI and extreme ADX readings, such a bounce wouldn’t be unusual, especially if whale accumulation translates into actual price support. The inclusion in new crypto ETFs could provide the catalyst, but technical repair takes time.
The bearish scenario triggers if DOGE fails to hold $0.161 on a daily close, which would likely accelerate selling toward the $0.142 August low. Such a move would trap recent buyers who entered on the whale accumulation news and potentially cascade into the $0.12-$0.13 zone where longer-term support resides. Volume on any breakdown would confirm whether this is capitulation or just another leg lower.
Given the oversold conditions, mature downtrend signals, and growing divergence between fundamentals and price action, the most probable near-term path is a relief bounce toward $0.178 that ultimately fails, setting up another test of support levels. Until DOGE can string together multiple daily closes above the 20-day EMA, rallies should be viewed as selling opportunities rather than trend reversals.