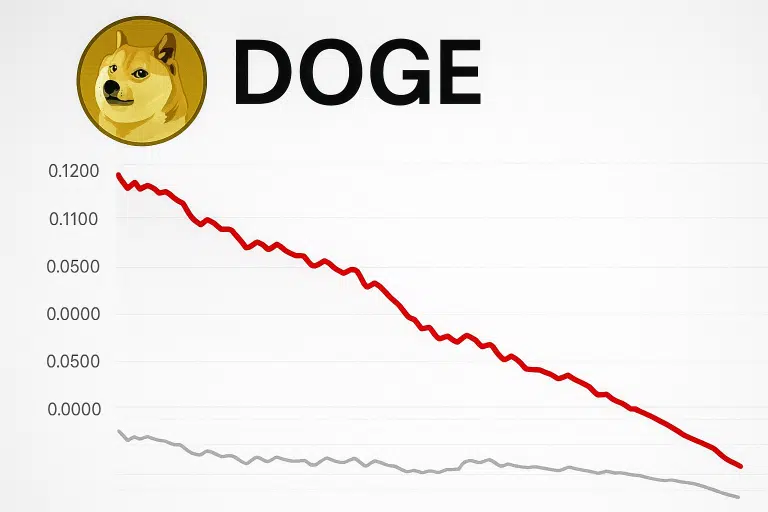
DOGE Tumbles 16.3% as Bulls Guard Critical $0.12 Support Zone
Market Pulse
- Dogecoin lost $0.025 in value this month, removing three weeks of positive results during a horrible week.
- Bulls are doing everything they can to keep the $0.123 support level intact following six straight declines at upper resistance.
- A launch of Coinbase futures gives some underlying backing, although the price action seems to disagree.
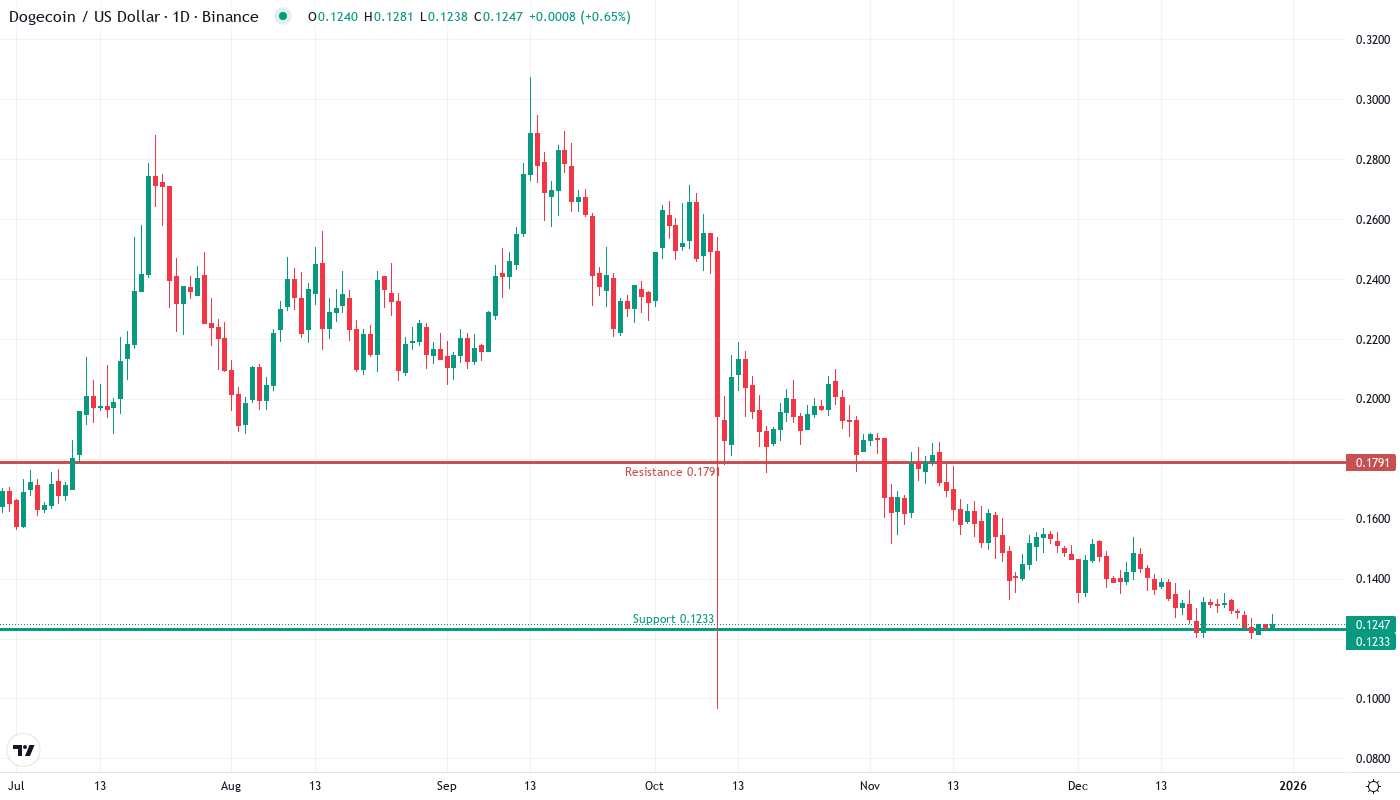
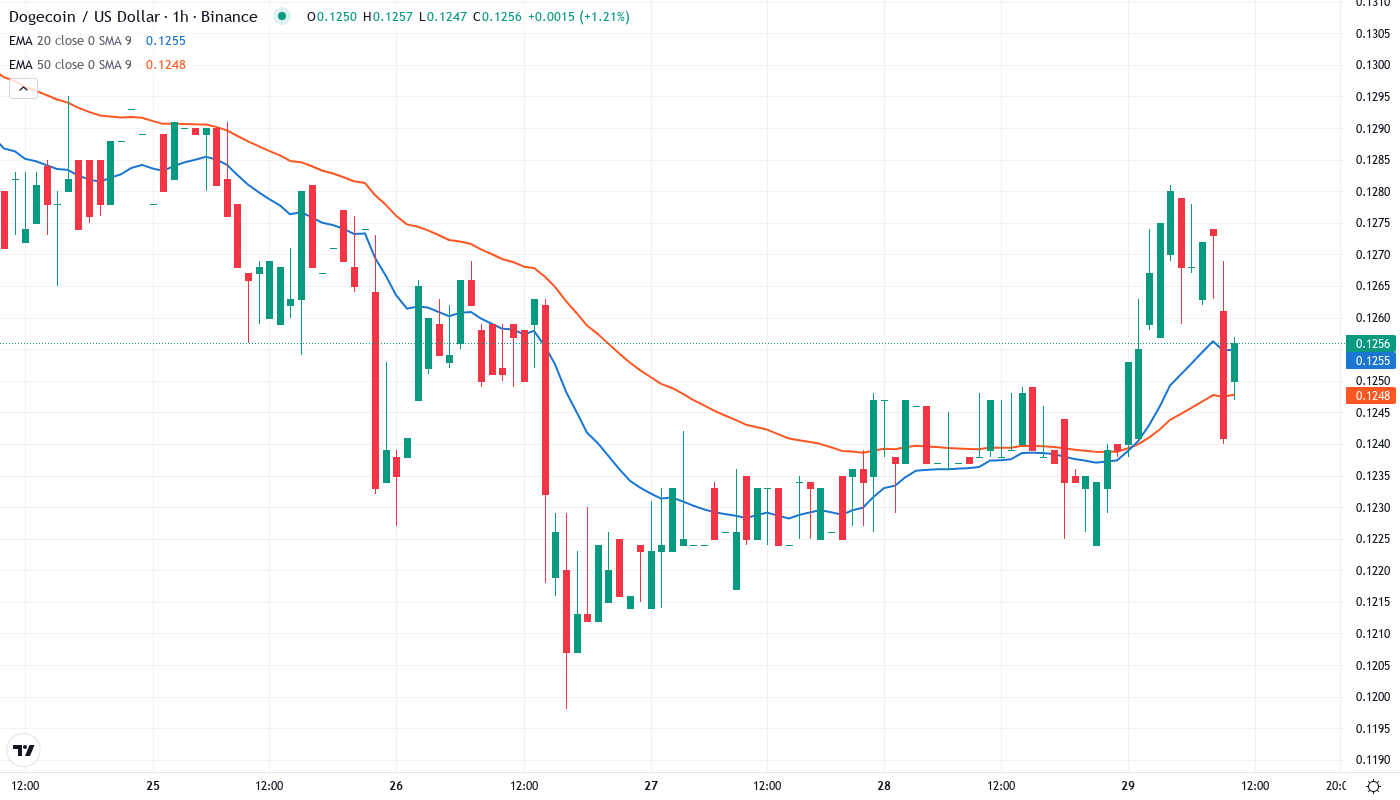
Dogecoin didn’t have a good month, contracting 16.32% as it finalized the week. The aforementioned closing levels down near $0.1256 on the week came about after that March’s monthly lows tested again. Over half of the year’s gains erased as DOGE stands 61.2% off the January peak price levels. Back in April, Coinbase’s futures introduction was intended to legitimize the market in the eyes of institutional players. The result, however, saw short-sellers deepen the declines by breaching the daily resistance and supports on the lower side. Currently, sellers face off against the buyers at the March lows. Will the bulls defend those defenses or will the deep psychological barrier tested at $0.10?
| Metric | Value |
|---|---|
| Asset | DOGECOIN (DOGE) |
| Current Price | $0.13 |
| Weekly Performance | -4.41% |
| Monthly Performance | -16.32% |
| RSI (Relative Strength Index) | 39.7 |
| ADX (Average Directional Index) | 35.8 |
| MACD (MACD Level) | -0.01 |
| CCI (Commodity Channel Index, 20-period) | -72.48 |
Momentum Exhaustion Signals Capitulation Phase Near Completion
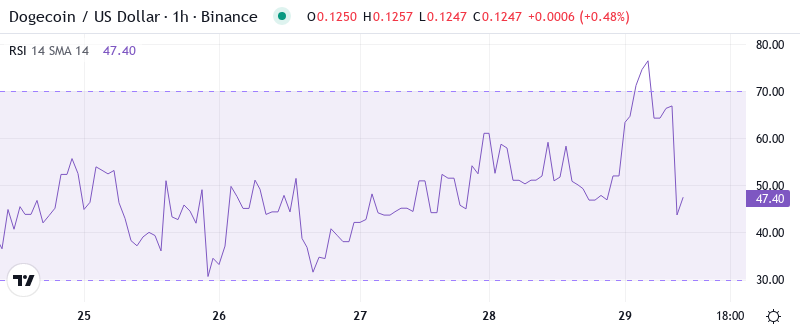
The Relative Strength Index (RSI) measures the speed and change of price movements. RSI reads between 30 and 70 are interpreted as neutral while readings below 30 are considered oversold, and readings above 70 are considered overbought. The RSI here is quick to capture recent pops in the price of BTC. A choppy sideways range week continues after a dramatic break from it last weekend. The slow crawl began after failing to push back above the February 2020 high following last week’s exhaustion gap. The primary trend momentum and bias remain quite positive.
What is interesting to note is that RSI hardly moved even after the Coinbase announcement of structural improvements – often times such news would cause at least a temporary spike in momentum. For those who swing trade, this weak oscillator response suggests that there is still a prevailing bearish pressure, meaning that any bounces will probably be used to distribute rather than accumulate. The weekly RSI at 35.91 confirms the overall weakness but it hasn’t reached the levels of previous major lows.
ADX at 35.75 Confirms Sellers Control the Trending Move
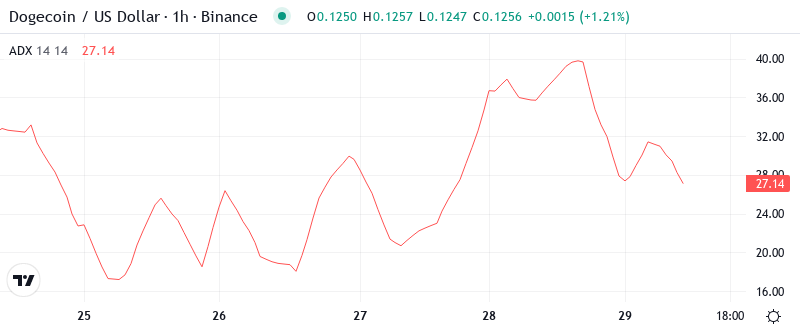
The readings about the strength of the trend clearly indicate an uptrend with the ADX dropping to 17.65. This is well above the 25 marks separating the range markets from the trends. This shows that we are witnessing a healthy uptrend with abated strength. The trend is presently the least potent since the April 23 peak of 73 cents.
When we look at the directional movement for ZI, the assumption is that sellers are currently holding control. This is based on the fact that the negative directional indicator or D1 is currently higher compared to the positive directional indicator (+DI). Currently, the negative directional indicator stands at 24.85, while the positive directional indicator for the stock stands at 13.47. This gap indicates that bears are pinning the price down and are driving the stock lower. No doubt, entering into a counter-trend position can be extremely enticing. However, day traders should trade with the broader directional movement, until either the ADX or average directional index drops below the suoer important level of 25. Alternatively, wait for the directional movement indicators to converge.
20-Day EMA at $0.1354 Caps Recovery Attempts
The technical analysis suggests a classic bullish bounce scenario where DOGE retraces to test underlying support in the sweep for stops. The EMA Ribbon indicator is not just a moving average stack that depicts trend strength. Traders often use the explosive release from these formations as an entry signal. An EMA Ribbon is comprised of numerous exponential moving averages that will tirelessly pinch or expand, depending on the degree of volatility in the price action$arity.
The most important is the compression building between the 100-day ($0.1660) and 200-day ($0.1824) EMAs above. These averages have a tendency to slope in the direction that price action heads once they start to curve, and in this case, they have been pushing lower. The last time the market crossed long-term averages to the downside was in early June, prompting further losses and triggering the sweeping capitulation low.
Support Architecture Crumbles Below $0.156 Monthly Pivot
There is strong resistance between the $0.1268 level (10-day EMA) and the $0.142 zone in which the monthly pivot middle is located. Sellers piled up at the $0.156 level which is the monthly S1 pivot that barred two comeback endeavors already. With the increasing resistance at each level, it’s clear that after breaking down this much, XRP needs an extended consolidation period to rebuild strength.
Bulls are currently attempting to defend the $0.123 support level after giving up the $0.133 mark at the beginning of the week. This area marks the monthly S2 pivot and has been tapped by buyers on six separate occasions since June, making it a crucial battleground. The advent of Coinbase futures spurred some short-term demand around this area but, as noted by traders, the volume was nothing compared to the wick that brought price into the zone.
The market structure indicates strong resistance as long as DOGE continues to trade below the $0.135 monthly pivot cluster. If we consider the measured move from the breakdown pattern, it indicates a target price of $0.108. This level is too close for comfort to the psychologically important $0.10 level, a price point that DOGE hasn’t seen since it began its accumulation phase in October 2023. If we rely solely on the technical analysis and assume that the futures catalyst won’t be enough to push the price above resistance, we may see DOGE fall even lower before an organic recovery can take place.
Bears Target $0.10 as Technical Breakdown Accelerates
Bulls need to ensure the price does not go below $0.135 to counter the immediate bearish pressure. After that, they must regain the 20-day EMA at $0.1354 to indicate a possible trend change. But to achieve these, other than exchange listings, new positive drivers are needed as technical traders will not participate until momentum oscillators highlight an oversold condition. The $0.16 price mark mentioned in our charts last week is no longer in the picture. First, we have to cross several hurdles.
If DOGE loses the $0.123 support on volume, there is an air pocket down to $0.108 and possibly $0.10. This would be more likely if the major crypto market fails to stabilize for DOGE’s high-beta nature. A pop below $0.12 on a weekly close would trap recent dip-buyers and probably trigger stop-loss selling with the next major floor at $0.098.
With the dominant downtrend being confirmed by ADX, persistent EMA resistance, and weakening support structure, the most probable near-term path has DOGE grinding between $0.115-0.135 before retesting lower supports. The Coinbase futures development provides a structural floor but can’t overcome the technical damage already inflicted. Until momentum indicators signal exhaustion and price reclaims at least the 20-day EMA, sellers maintain control of the narrative.