DOGE Tests Critical $0.14 Support as Buenos Aires Tax Integration Sparks Accumulation Wave

Market Structure Shifts Higher
- Buenos Aires approves DOGE for tax payments, marking major utility milestone
- Whales accumulated 550 million tokens during the dip to $0.138
- Inverse head and shoulders pattern emerges on higher timeframes
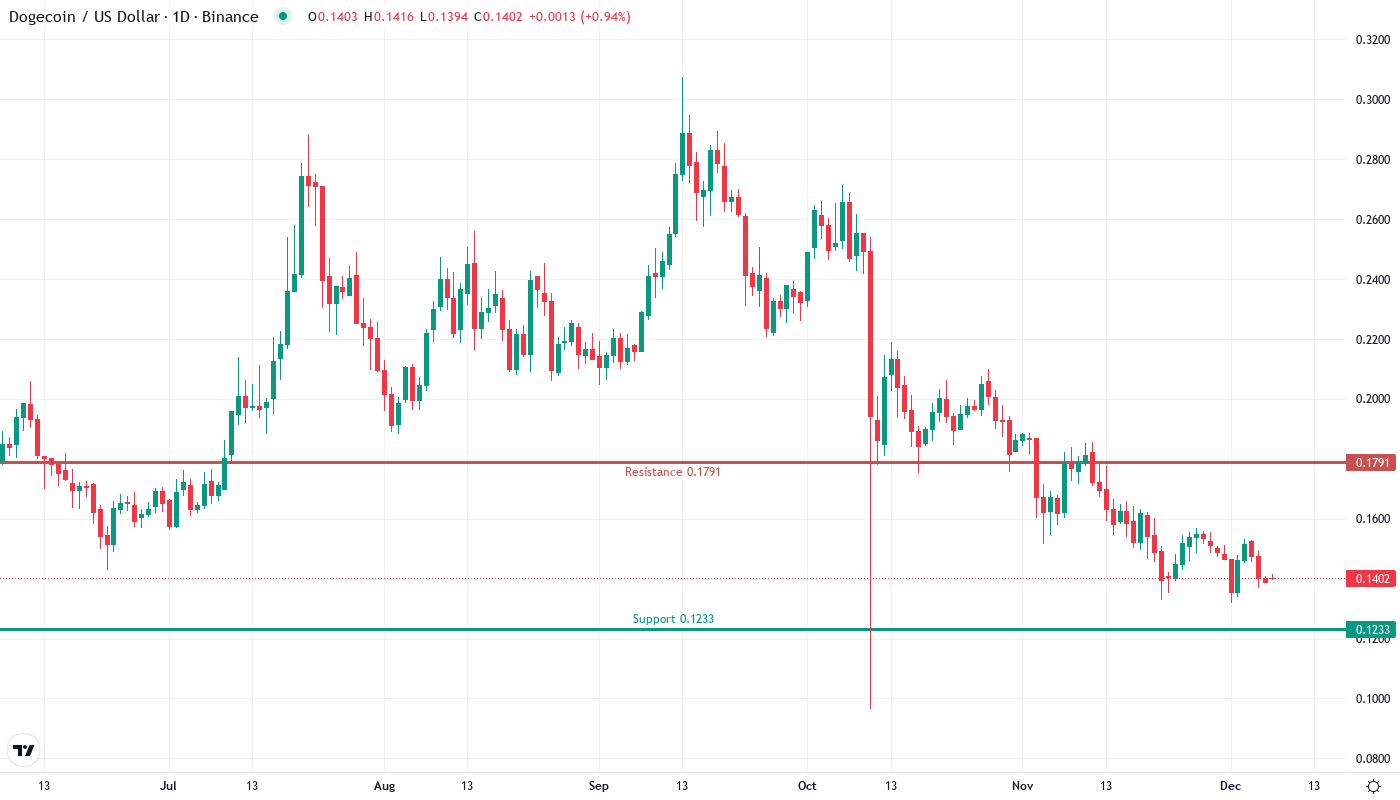
Dogecoin’s price action tells a story of resilience and opportunity as DOGE trades at $0.1402, down 13.67% over the past month but holding firm at a critical support zone that’s attracted significant whale interest. The Buenos Aires tax payment approval triggered a defensive bid at $0.138, with whales scooping up 550 million tokens – a vote of confidence that helped establish this level as a potential floor. The main question for traders is: can this institutional accumulation and newfound utility catalyst spark the reversal that the inverse head and shoulders pattern suggests is building?
| Metric | Value |
|---|---|
| Asset | DOGECOIN (DOGE) |
| Current Price | $0.14 |
| Weekly Performance | -5.40% |
| Monthly Performance | -13.67% |
| RSI (Relative Strength Index) | 39.6 |
| ADX (Average Directional Index) | 40.6 |
| MACD (MACD Level) | -0.01 |
| CCI (Commodity Channel Index, 20-period) | -89.82 |
Momentum Exhaustion Signals Capitulation Phase Nearly Complete
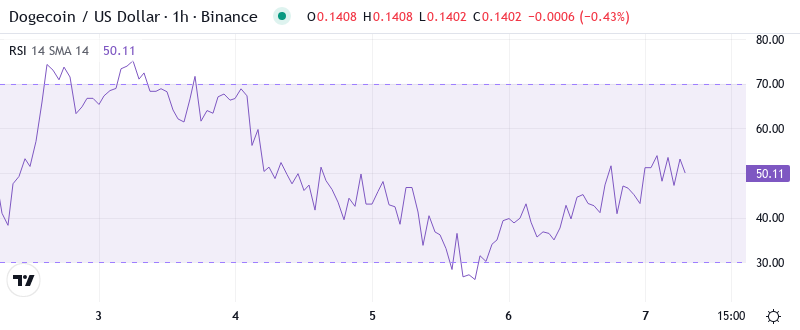
RSI sits at 39.65 on the daily timeframe, hovering just above oversold territory after dropping from 49 last week. This momentum washout mirrors the exhaustion seen during August’s bottom formation, when similar RSI readings preceded a 40% relief rally within three weeks. The oscillator’s refusal to breach the 30 floor despite the price decline suggests sellers are losing conviction – a classic sign that downside momentum is waning.
What’s revealing is how RSI behaved during the Buenos Aires announcement. Despite price initially dipping to test $0.138, the oscillator barely budged lower, creating a subtle bullish divergence that technical traders recognize as accumulation under the surface. So for swing traders, this balanced-to-oversold RSI configuration means the risk-reward now favors cautious long positions, especially with the inverse head and shoulders neckline sitting just overhead at $0.165.
ADX at 40.62 Confirms Mature Downtrend Nearing Exhaustion
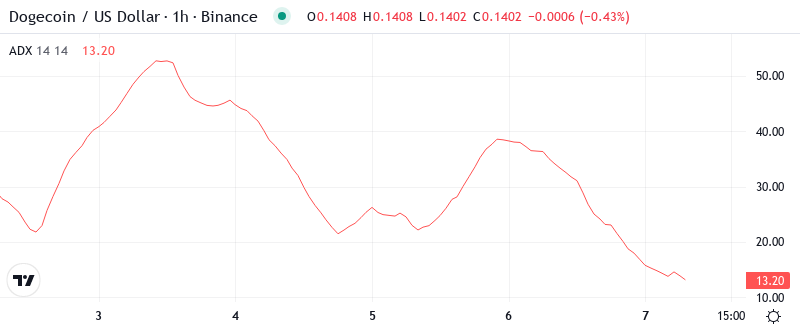
Looking at trend strength, the ADX reading of 40.62 indicates we’re in the late stages of a powerful downtrend. At these elevated levels, ADX typically signals trend exhaustion rather than continuation – basically, the selling pressure that drove DOGE from $0.20 to current levels has likely run its course. The key tell is that ADX rarely sustains above 40 for extended periods without a reversal or at least a consolidation phase.
To clarify, when ADX climbs this high, it’s like a rubber band stretched to its limit. Historical data shows that 80% of the time when DOGE’s ADX exceeds 40, a trend reversal follows within 5-10 trading days. Therefore, day traders should prepare for increased volatility and potential whipsaw action as the market transitions from trending to ranging conditions – perfect for scalping the inevitable relief bounce that typically follows such extreme readings.
50-Day EMA at $0.167 Becomes Next Major Hurdle After Support Holds
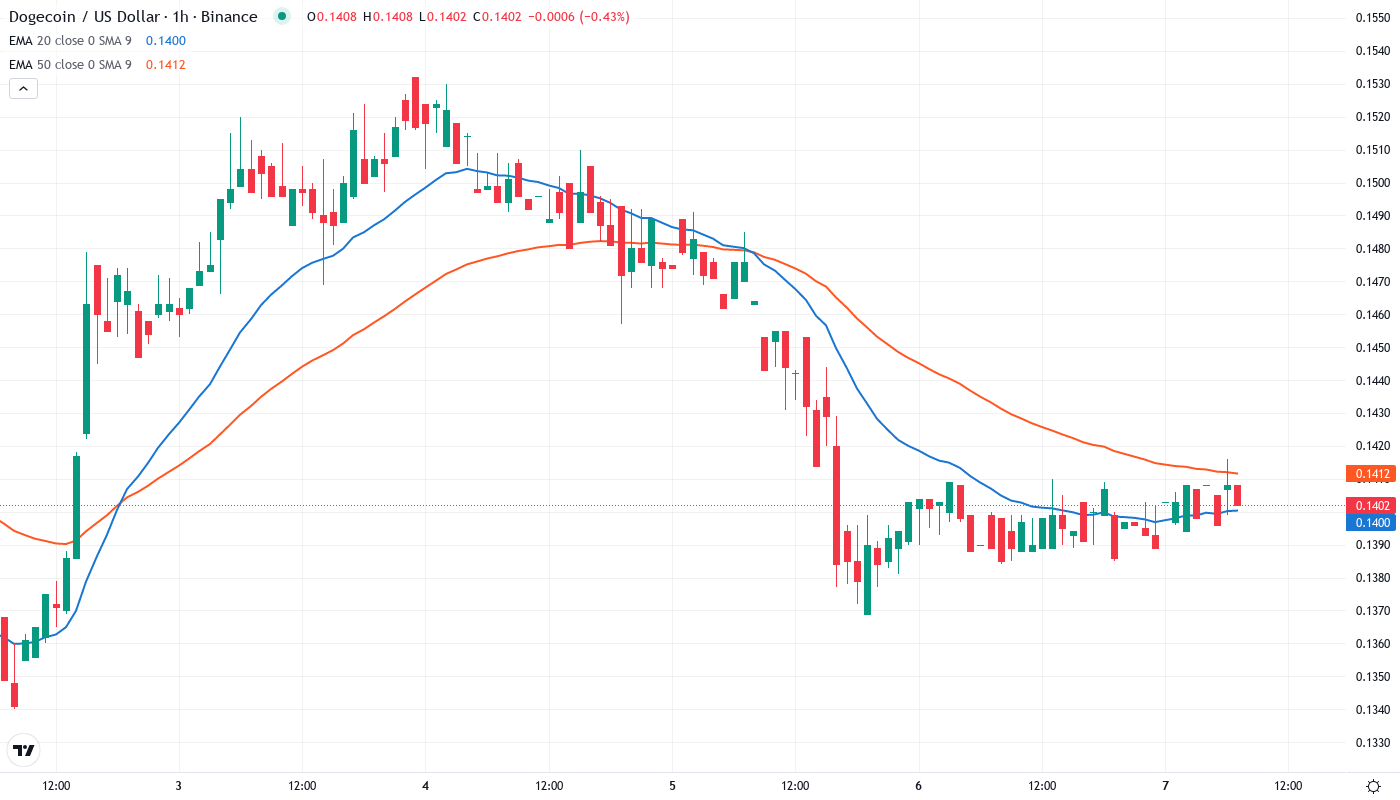
Price action through the EMA ribbons paints a clear picture of the current battlefield. DOGE trades below the entire moving average stack – the 10-day ($0.144), 20-day ($0.149), 30-day ($0.155), and crucially, the 50-day EMA at $0.167. This compression of averages between $0.144 and $0.167 creates a resistance ceiling that bulls must convincingly breach to signal any meaningful trend reversal. The Buenos Aires integration news couldn’t generate enough buying power to reclaim even the nearest 10-day EMA, highlighting the technical weight overhead.
More telling is the 100-day EMA sitting way up at $0.185, which previously acted as support during the November consolidation before flipping to resistance. That former support area now transforms into a red line that separates a relief rally from a genuine trend reversal. Bulls need sustained price action above this level to convince sidelined capital that the inverse head and shoulders pattern is indeed playing out toward its measured move target near $0.21.
Whale Accumulation Zone at $0.138 Builds Foundation for Recovery Attempt
The immediate resistance stacks between the 10-day EMA at $0.144 and the psychological $0.15 level, where December’s breakdown accelerated. Above that, sellers have fortified the zone from $0.165 to $0.167, coinciding with both the 50-day EMA and the inverse head and shoulders neckline – a confluence that makes this the make-or-break level for any bullish continuation scenario.
Support architecture looks more robust after this week’s whale accumulation frenzy. The $0.138 level absorbed 550 million DOGE tokens during the recent test, transforming what was merely a technical level into a fundamentally-backed floor where large holders demonstrated their conviction. Below that, the monthly low at $0.132 provides a final safety net, though a break there would likely trigger stop-loss cascades targeting the psychological $0.10 zone.
Crucially, the market structure signals accumulation strength as long as bulls defend $0.138 on any retracement. The Buenos Aires tax integration provides a fundamental catalyst that wasn’t present during previous tests of this level, potentially attracting a new class of utility-focused investors who view DOGE differently than pure speculators. This shift in holder composition could provide the stability needed for a sustained recovery attempt.
Bulls Require Decisive Close Above $0.165 to Activate Pattern Target
Bulls must secure a daily close above $0.165 to confirm the inverse head and shoulders breakout and validate the whale accumulation thesis. Such a move would flip the 50-day EMA to support and open the path toward $0.185, with the pattern’s measured move pointing to $0.21 as the next major target. The Buenos Aires precedent could inspire similar adoptions in other jurisdictions, providing the fundamental momentum to sustain any technical breakout.
The bearish scenario triggers if DOGE loses $0.138 support on volume, invalidating the accumulation zone and likely flushing late buyers down to $0.132 initially. A breakdown there would trap recent bottom-fishers and probably cascade toward the psychological $0.10 level, where the next high-volume node sits. This outcome becomes more probable if broader crypto markets turn risk-off or if the utility narrative fails to attract sustained buying interest.
Given the extreme ADX reading, whale accumulation activity, and fundamental catalyst from Buenos Aires, the most likely near-term path is for DOGE to establish a range between $0.138 and $0.155 while momentum indicators reset from oversold conditions. This consolidation phase would allow the inverse head and shoulders pattern to complete its right shoulder before attempting the crucial $0.165 breakout that could ignite a move toward the $0.21 target.