DOGE Drops 19.5% as ETF Speculation Meets Whale Distribution

Market Pulse
- Dogecoin shed nearly 20% this month despite two ETF applications hitting regulatory desks
- Whale sell-off totaling $700M overwhelmed ETF optimism, pushing price to $0.157
- Mid-tier accumulation suggests smart money sees value at current oversold levels
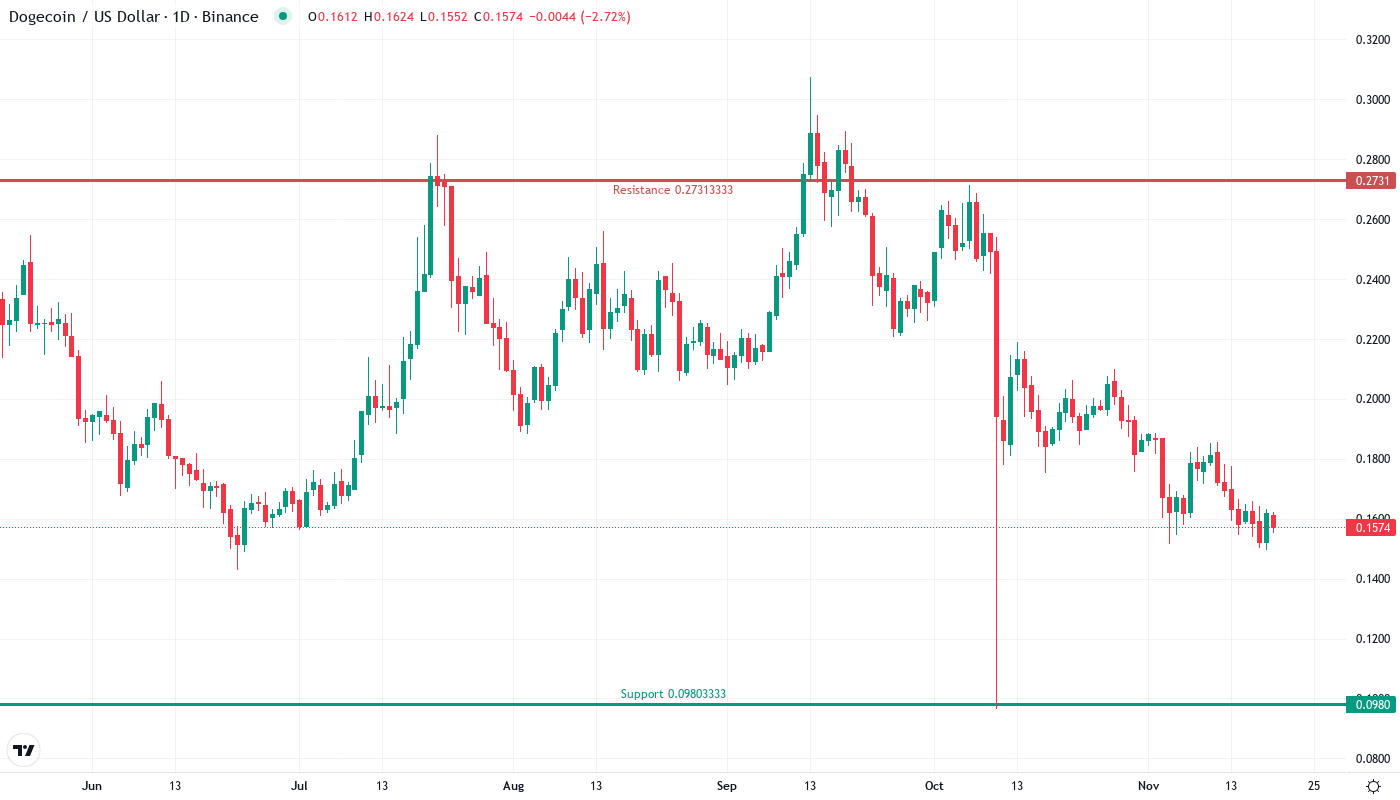
Dogecoin’s devastating 19.5% monthly drop to $0.1574 marks a harsh reality check for holders who expected ETF speculation to provide a floor. The main question for traders is: can institutional ETF interest overcome the bearish technical structure that’s developed since whales began distributing?
| Metric | Value |
|---|---|
| Asset | DOGECOIN (DOGE) |
| Current Price | $0.16 |
| Weekly Performance | -8.65% |
| Monthly Performance | -19.53% |
| RSI (Relative Strength Index) | 38.7 |
| ADX (Average Directional Index) | 41.2 |
| MACD (MACD Level) | -0.01 |
| CCI (Commodity Channel Index, 20-period) | -84.85 |
RSI at 38.69 Signals First Oversold Territory Since Summer Lows
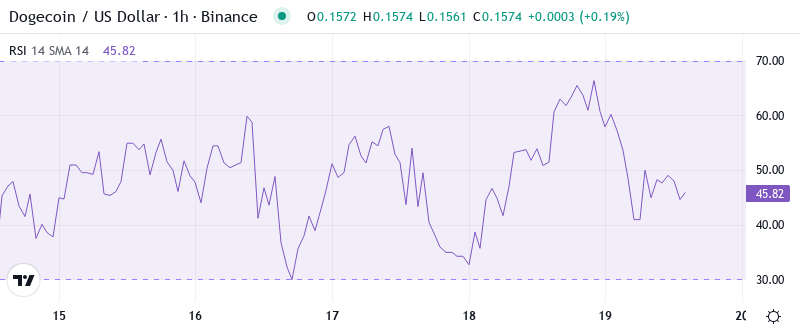
RSI sits at 38.69 on the daily timeframe, marking Dogecoin’s first genuine oversold reading since the August washout that preceded a 40% relief rally. The oscillator’s journey from neutral territory to oversold happened rapidly – just two weeks ago RSI held above 50 as ETF headlines initially sparked buying interest.
What’s revealing is how RSI behaved during the $700M whale distribution phase. Despite massive selling pressure, the indicator never reached extreme oversold levels below 30, suggesting sellers aren’t panicking but rather taking profits methodically. So for swing traders, this balanced oversold condition means bounce attempts could materialize near $0.145-0.150, though any rally faces heavy resistance from profit-takers who missed the exit above $0.20.
ADX at 41.24 Confirms Mature Downtrend Nearing Exhaustion
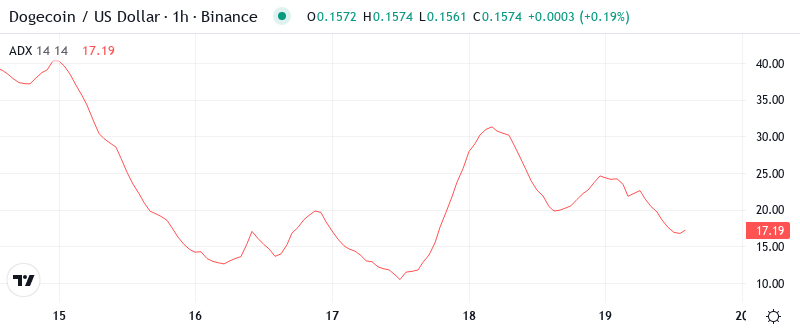
Looking at trend strength, the ADX reading of 41.24 signals we’re deep into a mature downtrend that’s approaching historical reversal zones. Basically, when ADX climbs above 40 in crypto markets, it often marks the final capitulation phase before trends lose steam.
The elevated ADX confirms what price action already shows – sellers dominated December’s tape with conviction. To clarify, this isn’t choppy consolidation but directional selling that trapped ETF speculation buyers. Therefore, day traders should expect volatility to remain elevated as this powerful downtrend transitions, with quick reversals likely as exhausted sellers meet ETF-driven dip buyers around psychological support levels.
20-Day EMA at $0.170 Now Caps Recovery Attempts
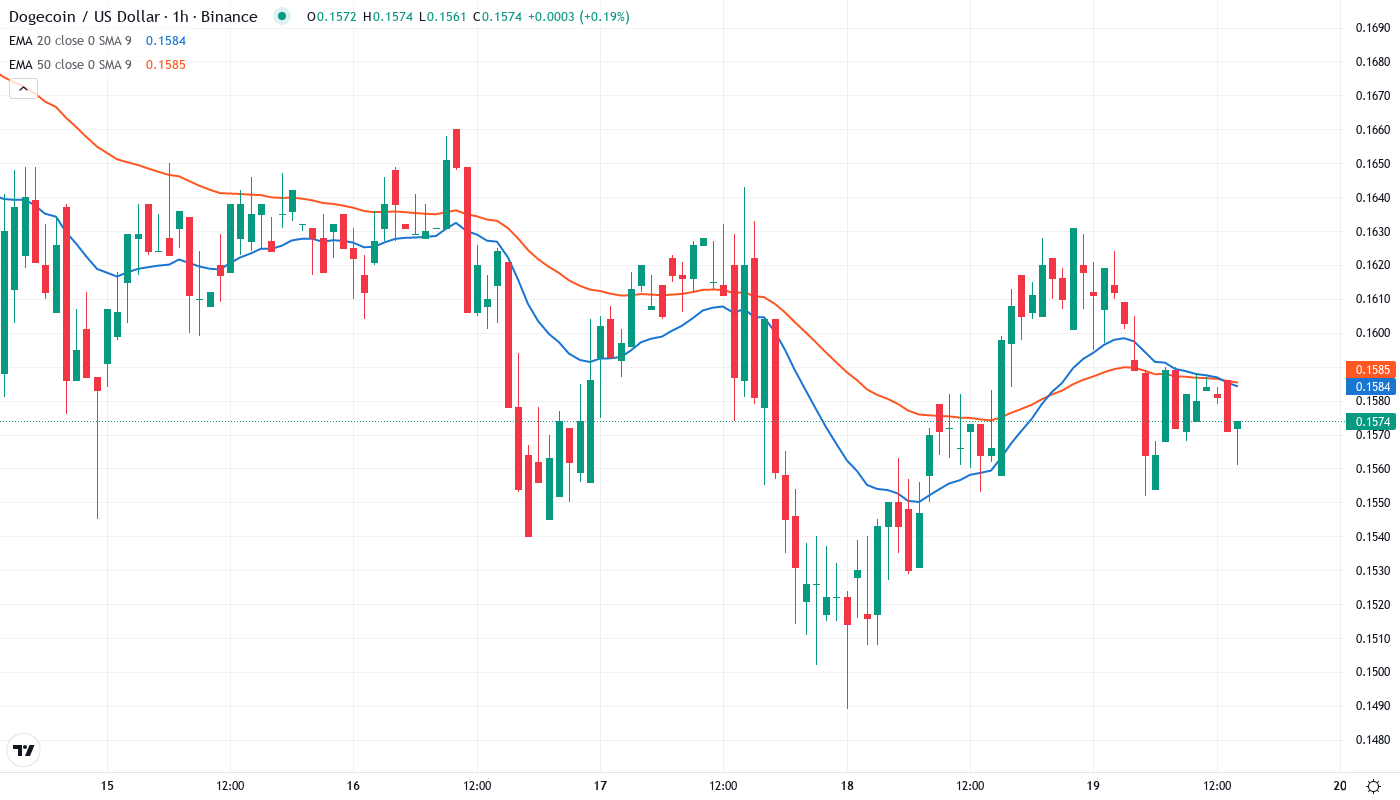
Price action tells a clear story through the EMA structure – DOGE trades below the entire moving average stack, with the 20-day EMA at $0.170 acting as immediate dynamic resistance. This level rejected advances twice last week as ETF enthusiasm met technical selling.
More concerning for bulls, the 50-day EMA at $0.177 and 100-day at $0.171 have compressed into a resistance cluster that coincides with the psychological $0.17 level. That former support zone from November now transforms into a formidable ceiling that bulls must reclaim to shift the narrative. The saving grace remains the 200-day EMA down at $0.148, still providing a safety net roughly 6% below current levels.
Resistance Wall Between $0.170-$0.185 Meets Support at $0.145
Above current price, sellers have fortified multiple resistance layers between $0.170 (20-day EMA) and $0.185 (monthly pivot), creating a 10% overhead supply zone where trapped longs await exits. The December highs near $0.210 feel distant given current structure.
Bulls defend two critical support zones that prevented a complete washout during the whale distribution. The first sits at $0.150, which caught three separate selloff attempts this month. Below that, the 200-day EMA at $0.148 converges with August’s major low around $0.145, forming what traders call the “line in the sand” for medium-term structure.
Market structure reveals an interesting divergence – while whales distributed $700M worth of DOGE, mid-tier holders accumulated aggressively near these support levels. This suggests smart money views the ETF narrative as legitimate despite near-term technical damage. The battle between whale distribution and institutional accumulation will likely resolve at the $0.145 support cluster.
Bulls Need Decisive Reclaim Above $0.170 to Revive ETF Rally
Should DOGE reclaim the $0.170 resistance cluster on volume, it would trap recent shorts and likely spark a squeeze toward $0.185, especially if Grayscale’s ETF application advances through regulatory channels. The technical setup would flip bullish with sustained trade above the 20-day EMA.
The bearish scenario triggers if whale selling resumes and price loses the $0.145-$0.148 support zone. Such a breakdown would likely flush positions down to $0.125, erasing the entire ETF speculation premium and potentially delaying institutional product launches.
Given the oversold RSI, exhausted ADX reading, and confirmed accumulation by mid-tier wallets, the most probable near-term path sees DOGE establishing a bottom between $0.145-$0.160 before attempting another leg higher as ETF clarity emerges in Q1.