Core Network Plummets 22% as Bears Tighten Grip Below Critical Support

Market Structure Shifts Lower
- CORE drops 22.3% this week, adding to the tough multi-month downtrend that has removed 80% from the yearly peaks
- Bears are still in command as the price stays below all significant moving averages indicating that distribution is still in place
- Oscillators signal oversold zone while basic structure of the market remains decisively bearish
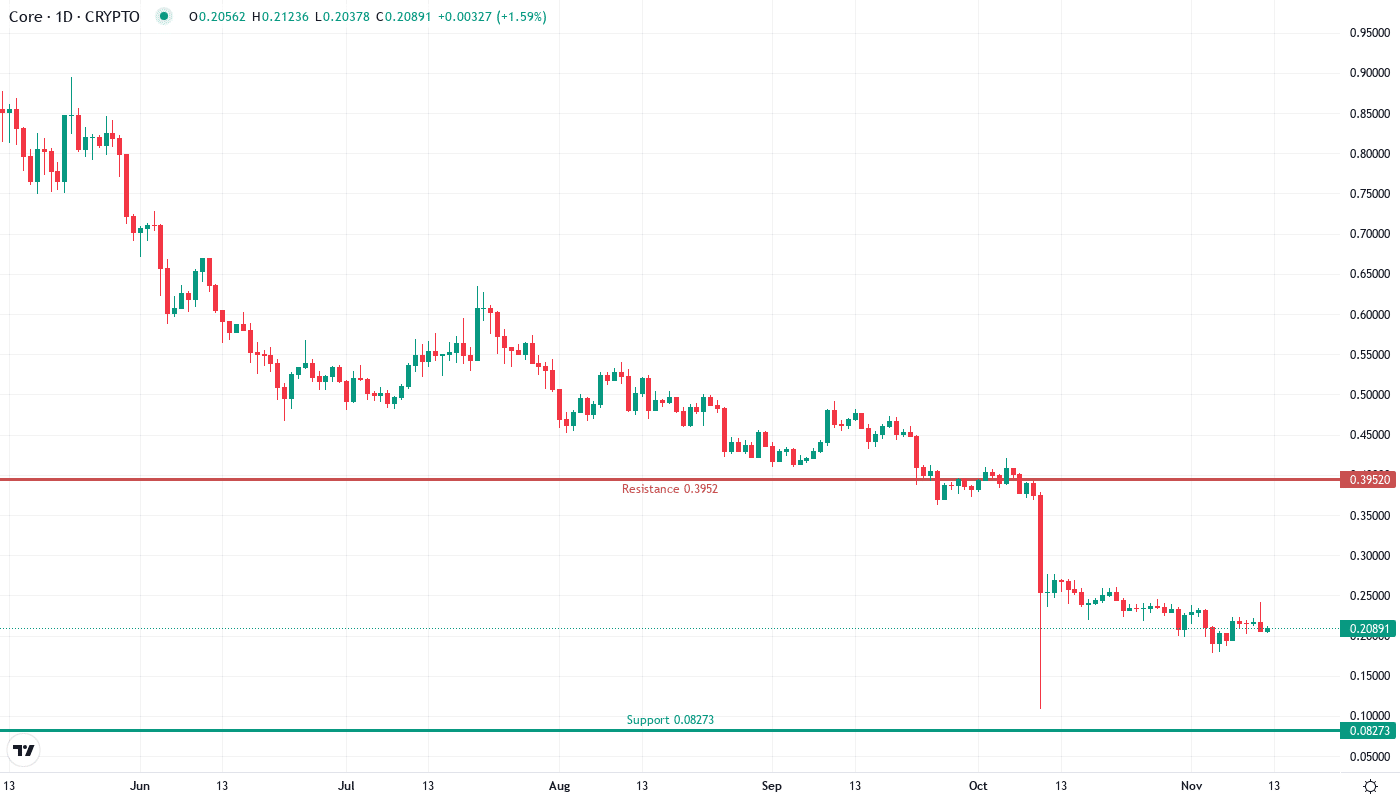
Core Network experienced a brutal decline this week as CORE lost another 22.3% and was trading at the low price of $0.2086, resulting in a devastating 80.7% decrease in its price from its yearly peak. The token has been suffering continuous losses despite the overall stabilization of the crypto market, with the sellers fiercely attacking any relief bounce efforts near the psychological level of $0.25. Recent events such as the launch of Quantus Network’s quantum-secure testnet and the inclusion of CORE in Binance’s expanded educational programs have not stopped the pressure of selling. The primary question that traders are wrestling with is: has this fallen knife finally come to a resting spot or will the bears succeed in pushing it completely below $0.20?
| Metric | Value |
|---|---|
| Asset | CORE (CORE) |
| Current Price | $0.21 |
| Weekly Performance | 9.35% |
| Monthly Performance | -22.34% |
| RSI (Relative Strength Index) | 38.9 |
| ADX (Average Directional Index) | 59.0 |
| MACD (MACD Level) | -0.02 |
| CCI (Commodity Channel Index, 20-period) | -63.06 |
RSI Signals Extreme Oversold Territory
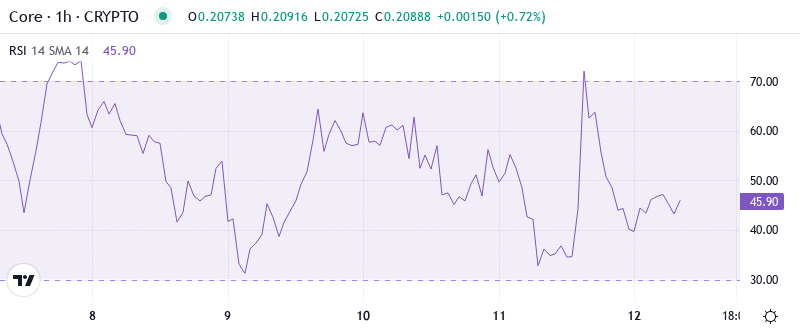
On the daily timeframe, the RSI index dropped to 38.85 which has entered into a deeply oversold region and is typically the one to make a relief bounce. This is the most considerable RSI print ever since the August capitulation, which was a time when the market had the same oversold conditions and bounced back for a short time like a dead cat flies before sellers took control again. Conversely, the weekly RSI shows 30.02 and the monthly one 34.22 which is a measurement of the longer trend so, they emphasize the longer-term bearish momentum is still intact, therefore, any oversold bounce will probably face strong resistance on the top.
For swing traders, this compressed RSI configuration presents a high-risk, high-reward setup. While the daily oversold reading hints at an imminent relief rally, the aligned weekly and monthly weakness warns that sellers will likely fade any bounce into resistance. Smart money waits for RSI to reclaim 45 on the daily with volume confirmation before attempting counter-trend longs, as premature bottom-fishing in a confirmed downtrend often leads to further losses.
ADX Confirms Strengthening Bearish Trend

An ADX reading of 58.97 has a strong impact on the bearish trend. According to the high ADX data, we are going through a relatively strong trending move instead of messy consolidation – that is, the selling pressure is still strong with no signs of weakness. When ADX level goes to more than 50 in a decrease, it usually indicates that the institutions are selling more and it forecasts that the price will drop more before the bottom appears.
The indication of the ADX, which is the Average Directional Movement Index, that Core has gone from a crawl decline to a rapid markdown is the point to emphasize. Just at the same time, the move from 40 to close to 60 on the ADX and the breach under the support level of $0.30 confirmed that the sellers are still in full control. Thus, the day traders should switch their tactics to the corresponding trend rules by pouring their attention on the short-side settings at resistance instead of the falling knives which are wrongfully perceived at support levels.
Moving Averages Paint Dire Picture
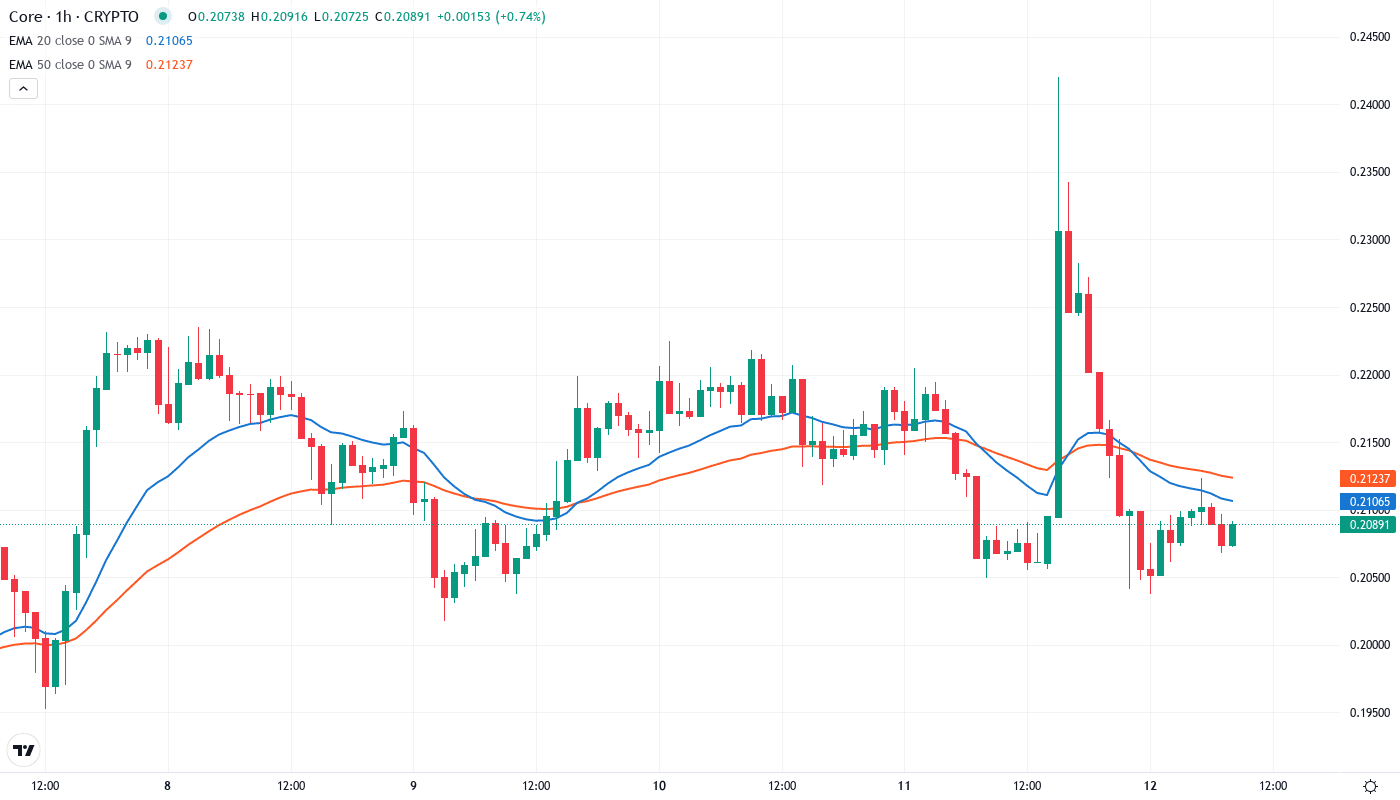
The EMA ribbons show how far Core has suffered in technical terms due to price action. CORE is subject to the below scenarios since it is trading significantly below all the important moving averages – the 10-day ($0.2126), 20-day ($0.2239), 50-day ($0.2410), 100-day ($0.2777), and 200-day ($0.3528) all slope downward in perfect bearish orientation. The decision regarding the most important EMA was indeed an action to be taken since the 50-day EMA rejected the price three times this month, thus having a metamorphosis from a support level that was viable through September into a very strong resistance.
The bearish EMA stack is a façade of resistance over which the bulls attempt to cross to indicate any trend change. The first and foremost challenge lies in the 10-day EMA close to $0.2126, which is just 2% higher than the current values. After that, the 20-day at $0.2239 and 50-day at $0.2410 make up the resistance set that has rejected every bounce attempt after the October breakdown. The price can only go up when it breaks above and stays above at least the 50-day EMA, that is why the simplest way is to stay down.
Critical Support and Resistance Zones
The first major resistance to any bullish reversal attempt would be the area from $0.2126 to $0.2239, the immediate resistance zone, where the 10 and 20-day EMAs gwoots rate with the recent negative highs. This area has capped three separate relief rallies over the past two weeks, and the first major hurdle for any bullish reversal attempt would be seen here. The additional resistance cluster up above is larger, it runs from $0.2410 to $0.2777 where the 50 and 100-day EMAs connect with the September consolidation lows that were previously seen as support.
The mental support level is the last fortress that stands қ0.20 which is the one that is going to break the $0.1779 weekly low through the air pocket. The current price at $0.2086 is only 4% above this crucial threshold, sitting precariously, as any reasonable decrease in the rates is likely to come with stop-loss cascades being triggered from the trapped longs. There are not much historical supports found under $0.20 compared to the $.15-$0.17 area from early 2023 which is a sign of a quick exit in such a situation.
The present market condition is evidently bearish, with all timeframes experiencing lower highs and lower lows. The formed dynamic of the bounces being unsuccessful due to the declining resistance levels and the problems with the support zones, proving that distribution continues, clearly states that this particular market structure is in the bearish zone. Barring a convincing daily close back above $0.2410 by the buyers, the setup-hater technical scenario is more toward the further downfall anticipations that could even lead to a washout low.
What Bulls Need for a Reversal
Initially, the bulls have to achieve a daily closing rate over the 10-day EMA which is at $0.2126 so as to stop the immediate bleeding, and hence they will also focus on the critical $0.2410 level where the 50-day EMA is located. A break above this zone with the volume sustained only-and thus, at best- indicate to us the trend exhaustion and the sideway buyers” interest. The Quantus Network’s advancements in quantum security and increased visibility on the Binance platform are the main reasons if the technical states are good.
In case the price stays staged below $0.2126 on any rebound attempt, the bears will keep the control. If the price breaks below the psychological support point of $0.20, that would be a strong confirmation for the next drop to the price level $0.1779 or even lower, which in turn might lead to the ultimate capitulation of the tired holders. The shortage of buying interest despite the oversold situation and the positive ecosystem developments indicate that the sellers are yet to finish.
The near-term scenario which should be prioritized is the CORE going sideways between $0.1950 and $0.2150. This is because momentum is strictly bearish with the price facing multiple resistance levels above. It may eventually either give in below $0.20 or take off with a more powerful relief. The rise that has been anticipated by the oversold bounce traders may remain very brief unless the market builds optimistic.