Chainlink Tests Multi-Month Resistance as DeFi Partnerships Fuel Recovery Momentum
Market Structure Shifts Higher
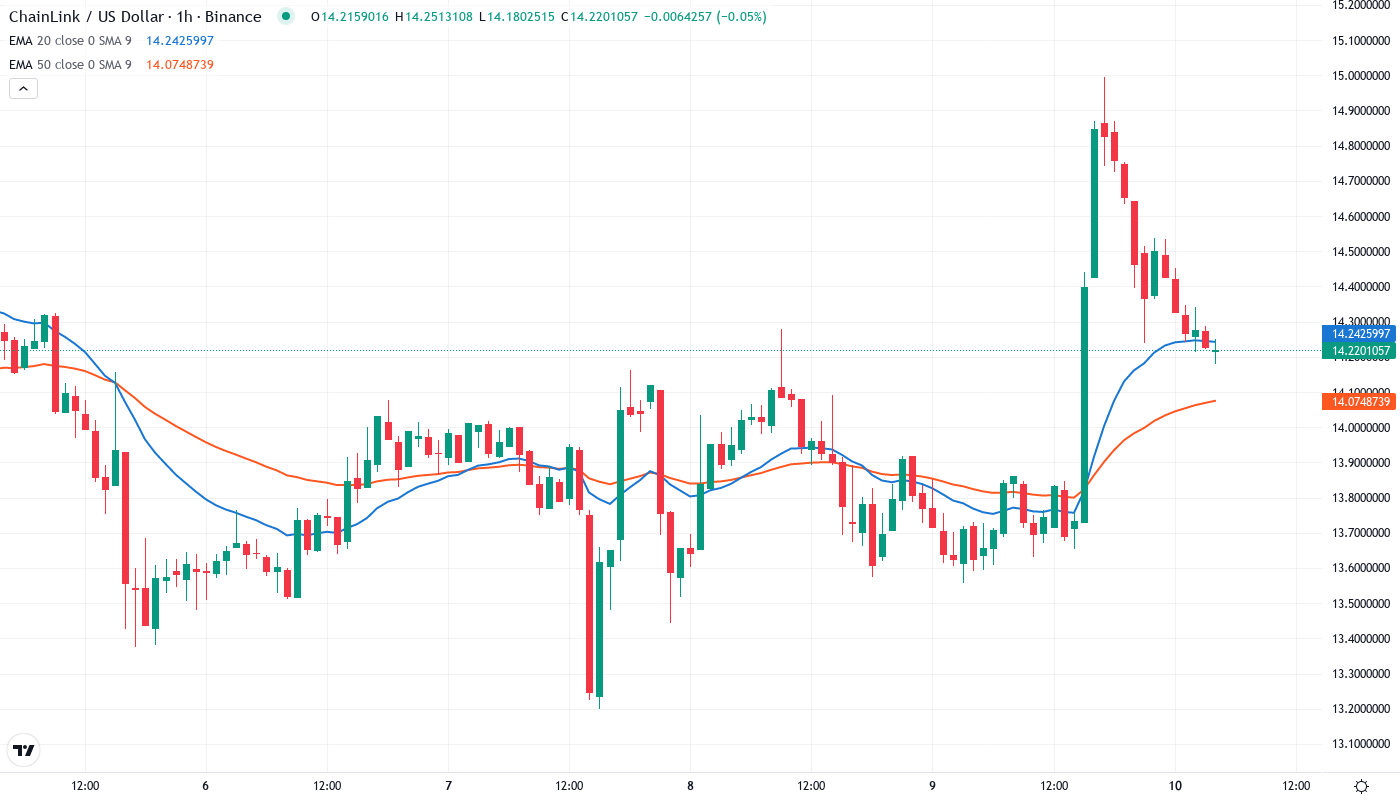
- LINK token up 14.25% from Nov. 7 local low, trading around $15.62.
- Price remains within a range established since Oct. 30 despite rebound.
- Momentum boosted by Mastercard partnership; key resistance at $16.87.
The LINK token has increased by 14.25% since reaching a local low of $13.93 on Nov. 7. Despite the significant rebound, LINK is trading inside a range in place since Oct. 30.
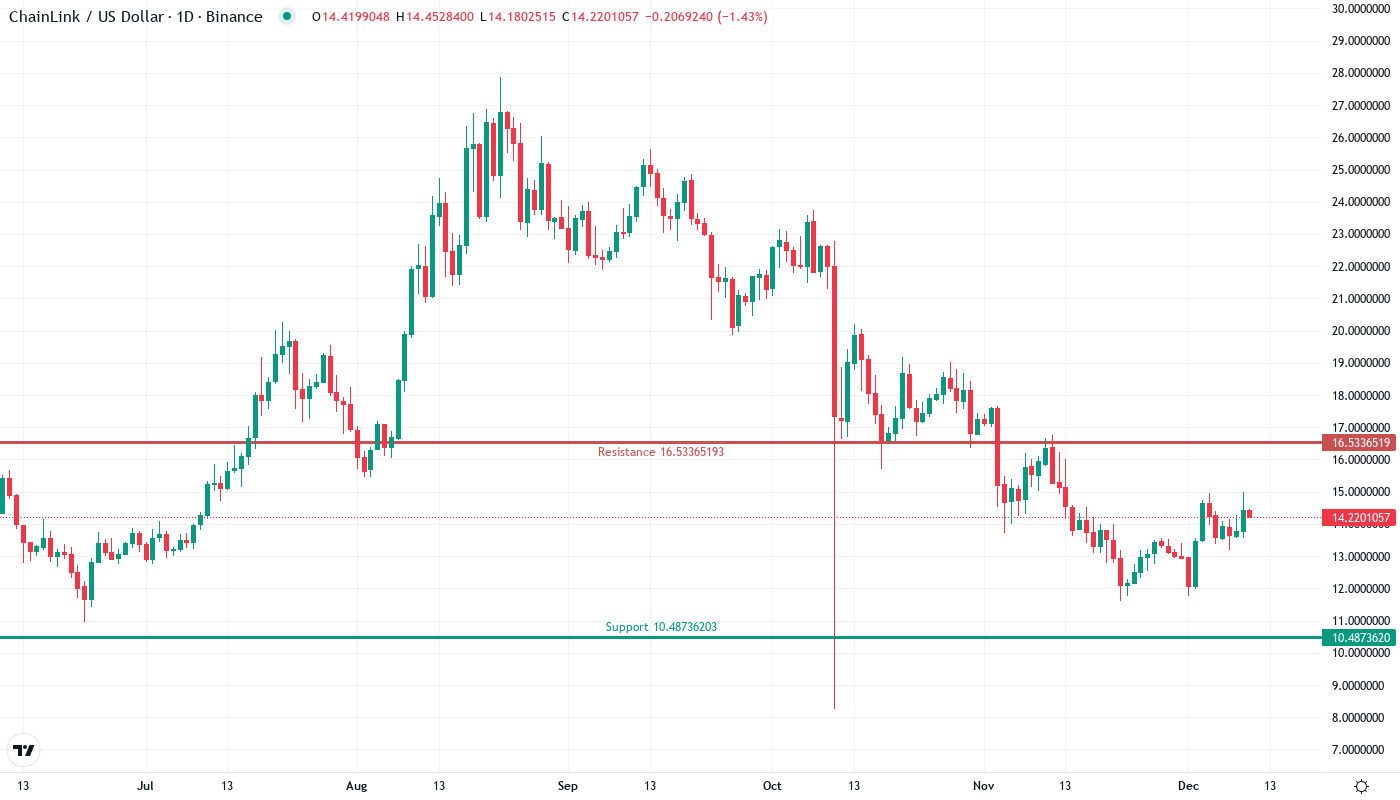
Chainlink has seen a 14.25% price increase over the past week as it trades near $15.62. The cryptocurrency had penetrated a triangle pattern on Mar. 1, approximately two weeks ago, and started to head lower. It began to form a new ascending triangle and has finally broken toward the upside. This comes following news that Mastercard partners with Swapper Finance for direct DeFi deposits, further solidifying LINK as the go-to infrastructure for connecting blockchain to traditional finance. The question now is whether or not this momentum can successfully break above the $16.87 resistance.
| Metric | Value |
|---|---|
| Asset | CHAINLINK (LINK) |
| Current Price | $14.25 |
| Weekly Performance | 5.71% |
| Monthly Performance | -10.22% |
| RSI (Relative Strength Index) | 52.0 |
| ADX (Average Directional Index) | 25.6 |
| MACD (MACD Level) | -0.15 |
| CCI (Commodity Channel Index, 20-period) | 109.05 |
Momentum Cools From Oversold Territory Without Exhaustion Signal
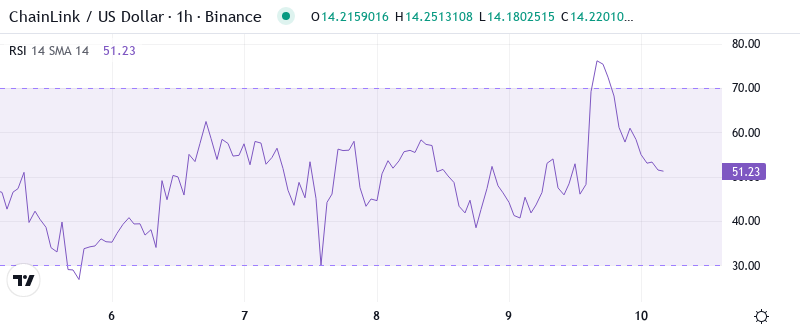
The LINK/USD one-day chart highlights a potentially bullish setup forming on the Relative Strength Index. At the time of writing, the RSI is at 52.04. This level indicates a solid recovery from the very oversold reading of 42.34 one week ago. Given the current neutral position of this oscillator, the bulls have some breathing room to push the price higher without encountering the risk of an immediate trend reversal. The fast recovery of the momentum is similar to the setup that was in place in September, when the RSI moved up from similar oversold levels before the Chainlink price rallied 35% to the October high.
For swing traders, this neutral RSI setup implies that the easier path is still to the upside, especially with the Mastercard news acting as a fundamental catalyst. That said, the weekly RSI of 42.34 still shows overall weakness, so any rallies should be confirmed by closing above key resistance areas for a few weeks before we can pronounce the current downtrend over.
ADX at 25.6 Confirms Trend Strength Building From December Capitulation
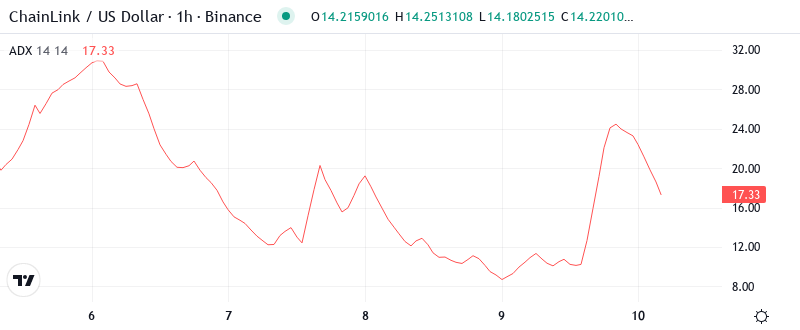
The ADX level at 25.6 implies that real momentum may finally be starting to build following several weeks of range-bound trading. The move above 25 suggests the escape from the duldrums we’ve experienced over the last month or so is lacking in conviction, which is a function of time. Our view has been that overly frothy conditions in areas like small-caps, global (ex. -U.S.) plays, and the FANGs may lead to a meaningful correction, but it will be a process not an event.
Hence, strategies would be in the direction of the move than playing the trading range. The ADX surge happens at the same time as the news of the Mastercard partnership which implies that the interest from institutional players is bleeding into actual price momentum. The trend strength is increasing, but not yet at extreme levels where exhaustion signals would appear.
50-Day EMA at $15.01 Flips to Support After Three Rejection Attempts
The next target will be the 100-day EMA at $16.47 which has also held as resistance on three separate occasions since the 22% drawdown in late-November. However, the 50 is about to bullishly cross-over the 100 if the current trajectory holds which should assist.
What is most revealing, though, is the compression between the shorter-term EMAs: the 10-day through 30-day are all within a $0.40 range, which creates a dense support zone between $13.86-$14.26. The 100-day EMA is the next major test at $16.58, with the psychological $17 mark just below it (that price point marked November’s local top). To confirm the trend change, bulls will have to take out this resistance confluence.
Resistance Stacks Between $16.58 and $17.28 as Bulls Eye Breakout
Sellers have built strong resistance between $16.58 and $17.28. This resistance zone is reinforced by the 100-day EMA, psychological resistance at $17, and the 200-week moving average. The R1 monthly pivot point at $18.05 would become the next possible target if the bulls push through the resistance area.
Bulls are in a much better position after this week’s rally through several moving averages. The floor is now much more solid than it was at the start of the year, starting with the 50-day exponential moving average (EMA) at $15.01. The 20-day EMA is at $14.11 and the December low of $11.60 is the last stop – and the line in the sand. A strong uptrend since the last pullback and a golden cross on the moving averages hint at TREN’s strength since Q4.
The setup indicates a collective breakout and continuation in the coming weeks could trigger significant buying pressure, making a move towards the previous all-time high at $20.44 highly probable.
Bulls Need Decisive Close Above $17 to Confirm Trend Reversal
If LINK were to rally beyond the 200-day EMA, $19 is the next target. If $19 is passed, the weekly level at $20 would be the next area of interest. The breakout from a falling wedge is still within its early stages. If this pattern were to dictate future price action, $14.88 should provide a solid bottom as it has been previous support and the breakout point.
The bullish case expects an eventual breakout that tests the all-time high squarely at $20.00, possibly yielding a momentum-fueled uptrend. However, it’s reasonable to expect a multi-week rally above $19 isn’t in the cards until the broader markets recover from recent setbacks.
With the strong uptrend looks like LINK has entered a consolidation phase, with this kind of action being healthy for the market as it will likely build a solid foundation of support that leads to further upside in the days and weeks ahead. How LINK trades in the coming few days should provide insights into its mid-term trend.