Chainlink Tests Monthly Low as ETF Filing Sparks Recovery Hopes

Market Pulse
- Shares of LINK, the native cryptocurrency of the Chainlink decentralized oracle network, enjoyed a sizeable bounce on December 10th after plunging to the lowest level since late November a day prior.
- The price move coincided with the arrival of a regulatory filing detailing the Bitwise leveraged Chainlink exchange-traded fund, suggesting the key test of that multi-month support could have been lifted as traders anticipate additional positive attention to the digital asset and fintech applications in Washington.
- Despite the oversold conditions offering a potential relief recovery, the bears remain in control of the technical’s longer-term.
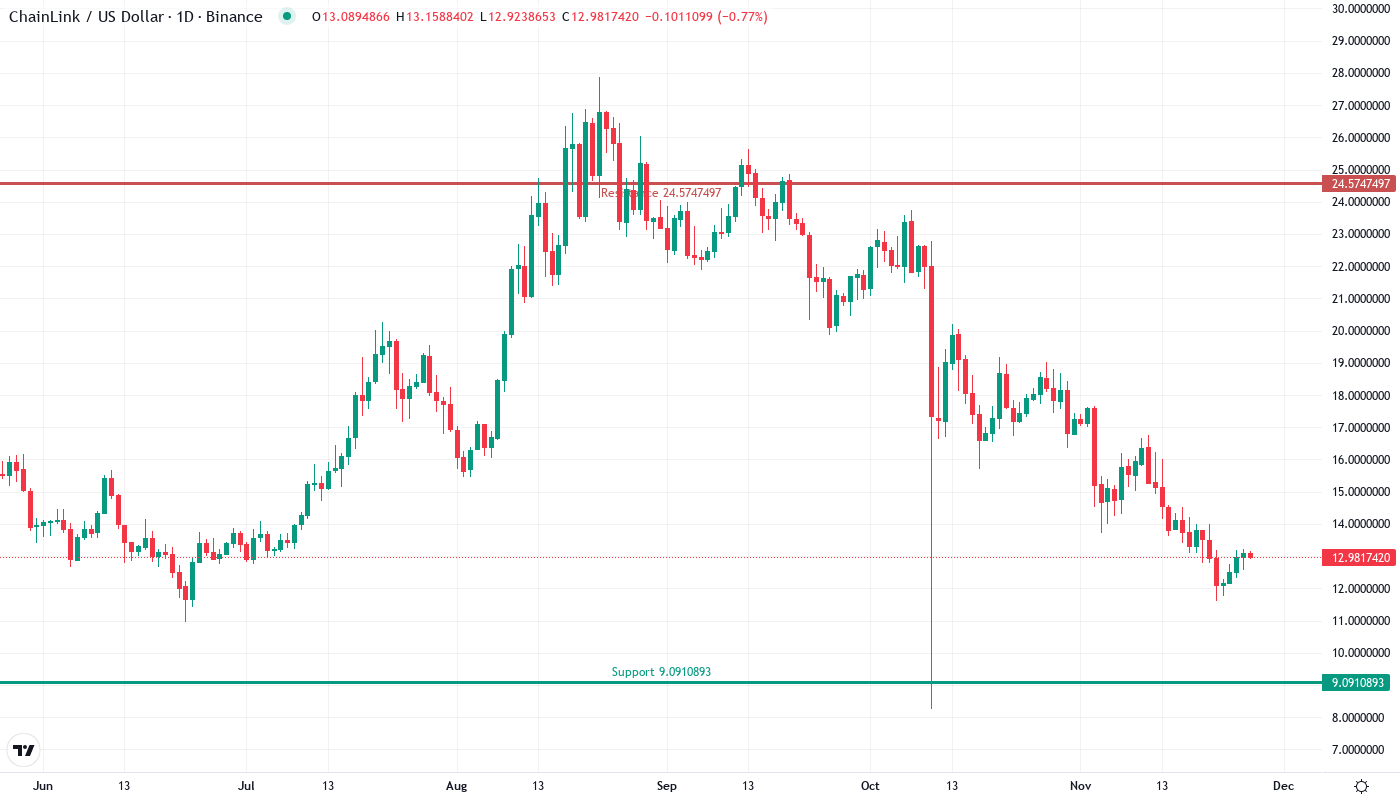
Chainlink quickly rebounded above $12.90 after a brutal fall to $11.60 – the cheapest level since March 26 – as Bitwise’s sudden ETF submission infused optimism into a beleaguered industry. A 30% monthly slump wiped out April, May, and June’s parabolic gains, but Wednesday’s 12% rebound from the nadirs caught the market bears by surprise. The most important issue for traders to consider now is whether this ETF-inspired uptick will hold and push prices into over $13.90 resistance.
| Metric | Value |
|---|---|
| Asset | CHAINLINK (LINK) |
| Current Price | $12.99 |
| Weekly Performance | -5.96% |
| Monthly Performance | -29.88% |
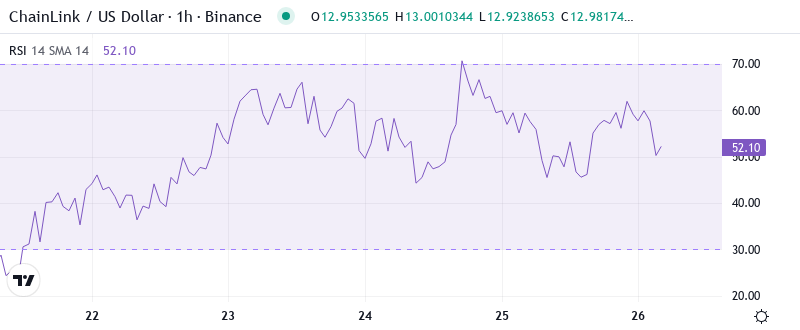
| RSI (Relative Strength Index) | 37.8 |
| ADX (Average Directional Index) | 45.2 |
| MACD (MACD Level) | -1.11 |
| CCI (Commodity Channel Index, 20-period) | -60.82 |
RSI Drops to 37.85 – First Oversold Signal Since August Capitulation
With the oscillator printing the most oversold and momentum exhaustion conditions since the pre-rally flush in late August, a reversion-to-the-mean relief rally appears imminent. This is particularly so given the encouraging fundamental tailwinds provided by the Bitwise ETF announcement. Buyers stepped in to fade the news, but the organic and durable quality of the institutional demand set to be sparked by the ETF greatly increases the likelihood that Bitcoin has bottomed for the next several months at a minimum.
What is interesting to note is the performance of the RSI during the bounce. Rising from 30 to 38 over one day indicates that actual buyers were present and not only short sellers covering their positions. Therefore, for swing traders, this oversold bounce provides a trading roadmap: continued moves above RSI 45 would confirm a bullish shift in momentum; a rejection back below 35 would signal that the downtrend is back in play. ETF speculation provided additional tailwinds for technical buyers looking for oversold levels.
ADX at 45.23 Confirms Mature Downtrend Nearing Exhaustion
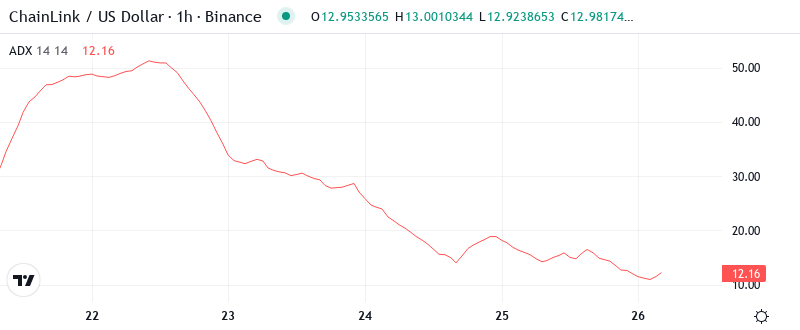
The current spike could lead to a swift correction with bears likely to highlight deteriorating volumes worth two weeks with the index in the red for three straight sessions. FOMC minutes reiterated a patient approach but ‘judged a near-term rate hike as unlikely.’ The dollar dropped sharply post-release while the 10y yield fell 3bps to 2.38%.
In simpler terms, the ADX suggests that although there was a clear dominance of sellers in December, the trend is getting old. Hence, day traders must get ready for more volatility and possible losses as the trend gets old and loses momentum. The Bitwise filing arrived at the best possible time for the bulls, who are eagerly searching for reasons to push against the overly long-term trend.
20-Day EMA at $14.68 Becomes First Major Resistance Target
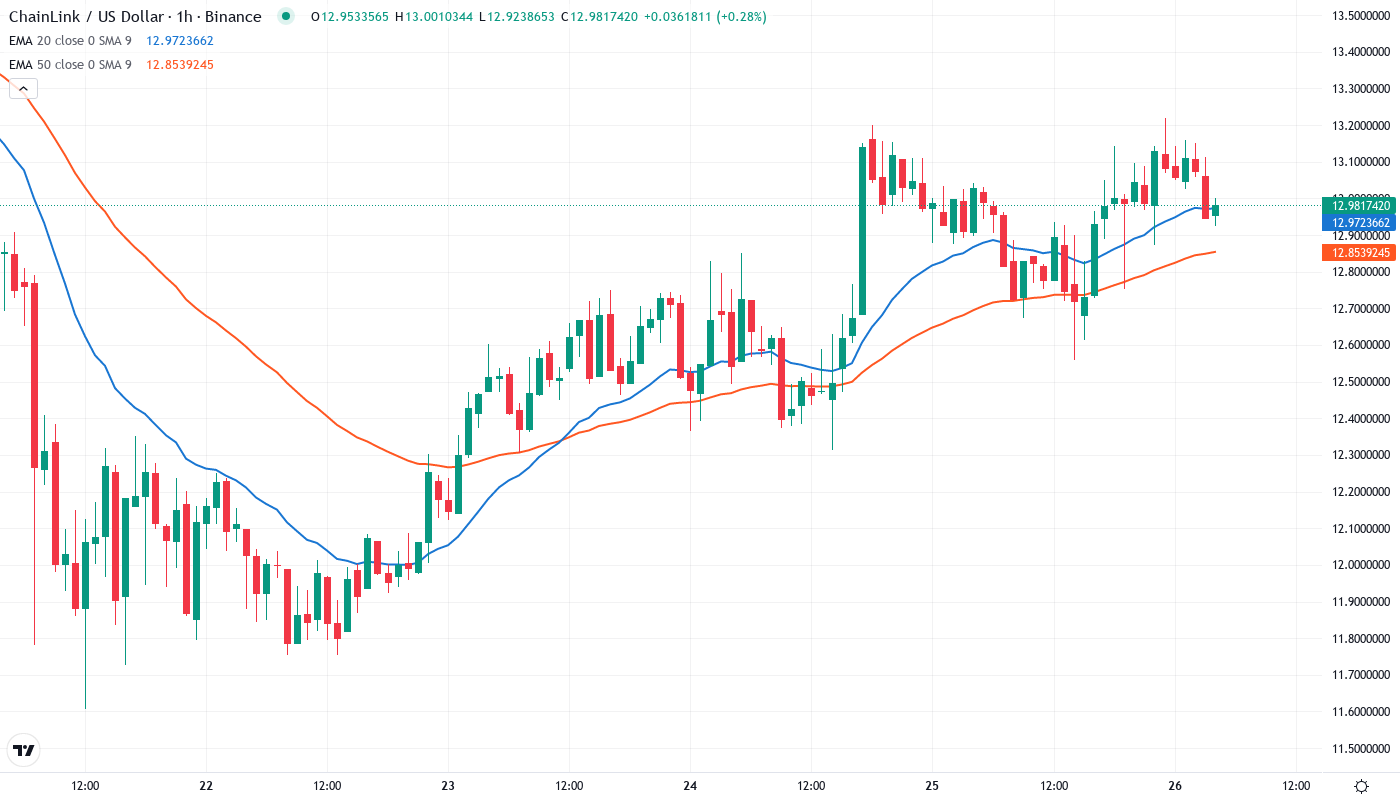
The market is somewhere between panic and disillusionment, and the free-fall feels endless, following the 50-day moving average as support fell out three days ago. A finishing wave 5. This did not even hold up on 30-min candles. The first price target is the 100-day worldwide moving average of $10.74. The second likely bounces here are extremely oversold conditions.
When we take a step back and look at the bigger picture, that previous support area between $14.50-14.70 turns into the aforementioned red line that the bears will be looking to keep as resistance. The 50-day EMA at $16.00 remains the key resistance level above that after capping the rally at the beginning of December. To change the short-term momentum bulls would need to recapture at least the 20-day. We expect the bears to defend this level quite fiercely as support turned to resistance.
Support at $11.60 Holds as Bulls Mount Defense at Monthly Low
There is immediate resistance stacked between $13.41 (monthly pivot) and $14.68 where the 20-day EMA intersects December’s breakdown level. Sellers will be playing defense here, as a failure to maintain this zone exposes a squeeze to $16.00. The Bitwise ETF news has already prompted one shot at these levels which got denied at $13.20.
The support architecture looks more constructive after yesterday support at $11.60 held for the third time since November. Bulls guar the monthly S1 at $10.81 as the next major downside target. Any daily close below $11.60 would likely trigger stops toward that level.
Importantly, the market structure is akin to a descending wedge pattern with support at $11.60 and resistance falling from $17.52 to current levels by $14.70. Compression of this kind generally causes an explosive move, and the ETF news could be what the bulls require to push a breakout above the 20-day EMA.
Bulls Need Sustained Break Above $14.68 to Confirm Trend Reversal
If LINK were to reclaim and maintain the 20-day EMA at $14.68, technical buyers are likely to take a shot at the 50-day at $16.00, with the ETF story underpinning the bull case. However, volume will have to increase on a daily close above $14.00 to signal that institutions are getting involved and not just retail traders.
The scenario becomes invalid if buyers can protect and hold above the EMA ribbon after a retest of $12.50, sideways action would shift momentum back to bulls for a breakout toward $13.41.
Considering the oversold technicals combined with some ETF news that could be a game-changer, the most likely path of least resistance in the near-term for LINK is to consolidate somewhere between $11.60 and $14.00 as the collective unconscious of the market has a chance to assimilate the implications of the Bitwise ETF filing before making a more definitive break.