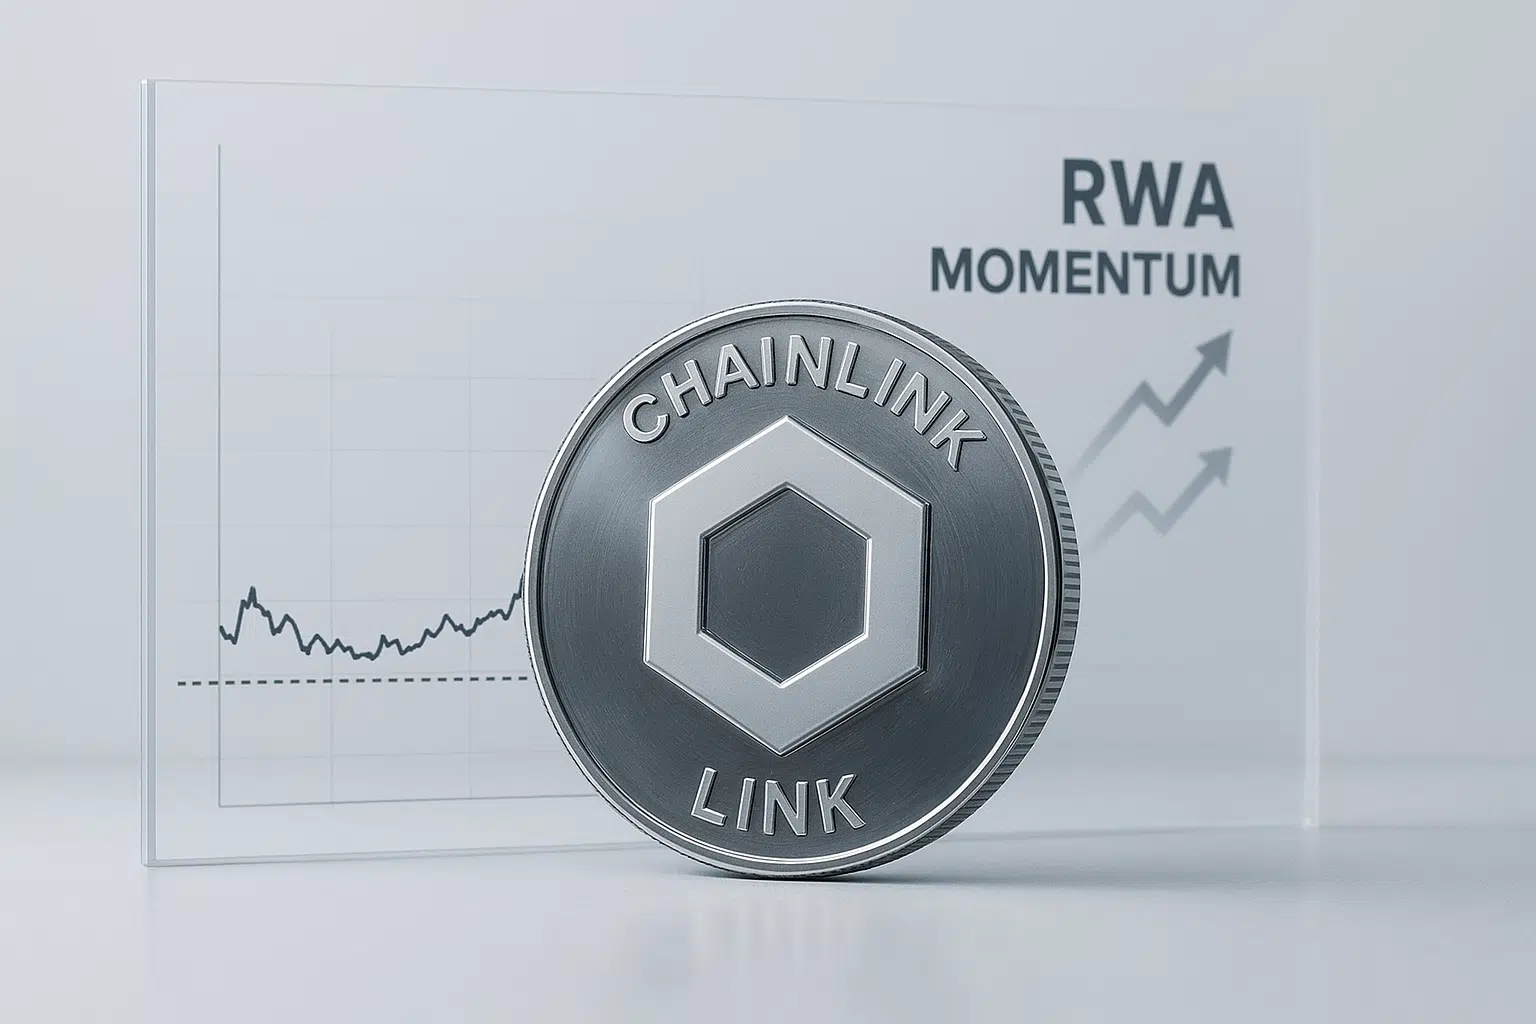
Chainlink Tests Critical Support as RWA Momentum Builds Despite Price Weakness
Market Structure Shifts Higher
- LINK trades at $14.12, defending crucial support after an 18.9% monthly decline
- RWA perpetuals launch and institutional integrations signal expanding utility
- Technical compression between $13.60-$17.50 sets stage for directional move

Chainlink slid 18.9% over the past month to $14.12, erasing gains from earlier this year despite a flurry of real-world asset (RWA) integrations that typically drive institutional interest. The oracle network’s native token now hovers just above its monthly low of $13.60, a level that has attracted buyers six times since June. With ApeX launching RWA perpetuals using Chainlink Data Streams and Dusk adopting CCIP for regulated assets, the disconnect between fundamental momentum and price action creates an interesting setup. The main question for traders is: will the expanding RWA ecosystem provide enough fuel to defend support, or does the technical weakness signal deeper problems ahead?
| Metric | Value |
|---|---|
| Asset | CHAINLINK (LINK) |
| Current Price | $14.12 |
| Weekly Performance | -9.02% |
| Monthly Performance | -18.86% |
| RSI (Relative Strength Index) | 36.2 |
| ADX (Average Directional Index) | 42.3 |
| MACD (MACD Level) | -1.08 |
| CCI (Commodity Channel Index, 20-period) | -108.46 |
Momentum Holds Mid-Range Despite Month-Long Slide

RSI sits at 36.24 on the daily timeframe, hovering just above oversold territory after the recent selloff. This reading mirrors September’s configuration when LINK bounced from similar levels to gain 35% within three weeks. The oscillator’s refusal to break below 30 despite the aggressive selling suggests accumulation is occurring beneath the surface.
What’s revealing is how RSI behaved during the RWA announcement surge – it barely budged above 40, indicating sellers used any positive news as exit liquidity. So for swing traders, this balanced-to-weak momentum means waiting for either a clean break below 30 for capitulation trades or a reclaim above 45 to signal genuine trend reversal.
ADX at 42.25 Confirms Strong Bearish Trend in Motion
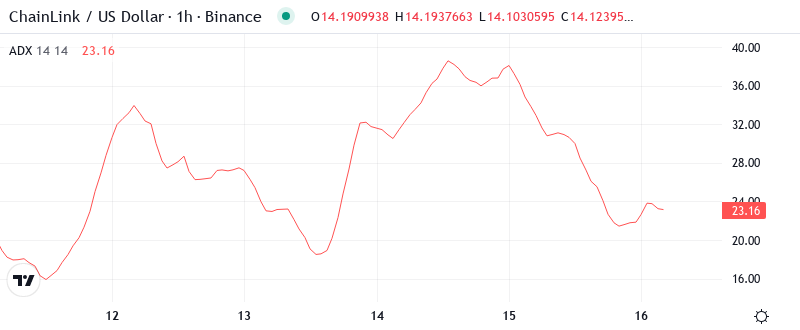
Looking at trend strength, the ADX reading of 42.25 signals we’re in a mature downtrend with conviction behind the selling. Values above 40 typically mark exhaustion zones where trends either accelerate into climactic moves or begin to reverse. The recent RWA integrations haven’t dented this bearish momentum yet.
Basically, being in this zone means volatility expansion is likely – either bears push for a final flush below $13.60 support or bulls stage a violent reversal fueled by the fundamental improvements. Therefore, day traders should prepare for larger-than-normal ranges and potential whipsaw action as this high ADX reading rarely sustains for extended periods.
20-Day EMA at $15.66 Caps Recovery Attempts
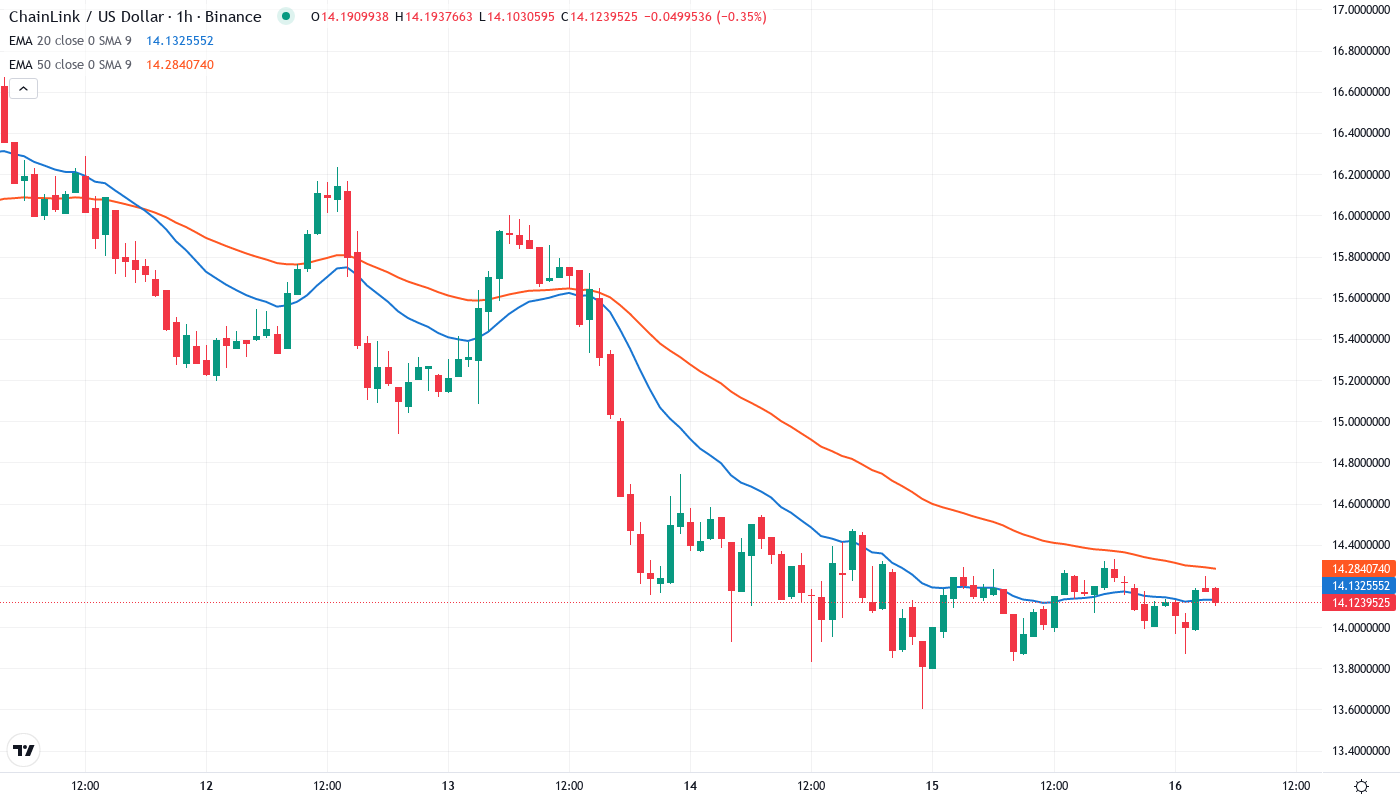
Price action reveals a clear bearish structure through the EMA ribbons. LINK trades below the entire moving average stack – the 10-day ($14.86), 20-day ($15.66), and critically, the 50-day EMA at $17.53. Each average now acts as resistance, with the 20-day EMA rejecting three separate recovery attempts this month despite positive RWA headlines.
More telling is the compression between current price ($14.12) and the 200-week EMA lurking at $18.33. This represents a 30% gap that needs filling for any sustainable bull market to emerge. The 50-day EMA at $17.53 stands as the first major hurdle – that former support area now transforms into a red line that bulls must reclaim to shift the intermediate trend.
Support at $13.60 Faces Seventh Test as Resistance Stacks Above
Above current levels, sellers have fortified positions between $15.66 (20-day EMA) and $17.53 (50-day EMA). The psychological $17 level gains extra significance as it aligns with the compression zone mentioned in recent analysis. December’s highs near $19.19 feel distant, requiring a 36% surge to revisit.
Bulls defend a critical support cluster between $13.60 (monthly low) and $14.12 (current price). This zone has held six times since June, making it a well-tested floor. The expanding RWA ecosystem – with ApeX perpetuals and Dusk’s regulated asset adoption – provides fundamental backing for this support.
Market structure reveals a coiled spring setup: strong support below, heavy resistance above, and decreasing volatility despite high ADX. This configuration typically resolves with a 15-20% directional move. The RWA narrative provides the catalyst, but price needs to confirm which direction the spring uncoils.
Bulls Need $15.66 Reclaim to Validate RWA Momentum
Should LINK secure a daily close above the 20-day EMA at $15.66, it would mark the first moving average reclaim in a month. Bulls could then target $17.53 (50-day EMA) while the expanding RWA integrations provide ongoing fundamental catalysts. A push through $17 opens the path toward December’s highs.
The bearish scenario triggers if $13.60 support finally breaks after seven tests. This would likely flush positions down to $11.50-$12.00, where the next major support cluster waits. The disconnect between positive RWA developments and negative price action suggests this breakdown would trap recent buyers betting on fundamental improvements.
Given the mature downtrend (ADX above 40) meeting battle-tested support ($13.60) while RWA adoption accelerates, the most probable near-term outcome is a violent move in either direction within 5-7 days. The fundamental-technical divergence rarely sustains this long without resolution.