Chainlink Tests Critical Support as Mastercard Partnership Brings 3.5 Billion Users to DeFi

Market Structure Shifts Higher
- LINK traded at a monthly low of $11.60 after dropping 40% from December highs.
- An inverted head and shoulders pattern targets a move to $16.50, with resistance between $15–$16.
- Swapper Finance’s Mastercard integration connects 3.5 billion cardholders directly to Chainlink DeFi.
The price of LINK experienced a strong rebound on Friday, as data from the LINK Marines shows that LINK traded at a monthly low of $11.60 the day before. This drop of 40% from the December highs came as the value of Chainlink recently soared from $1 to $32 in less than a year. After Swapper Finance’s integration of Mastercard was announced, the 3.5 billion cardholders were put directly on Chainlink DeFi.
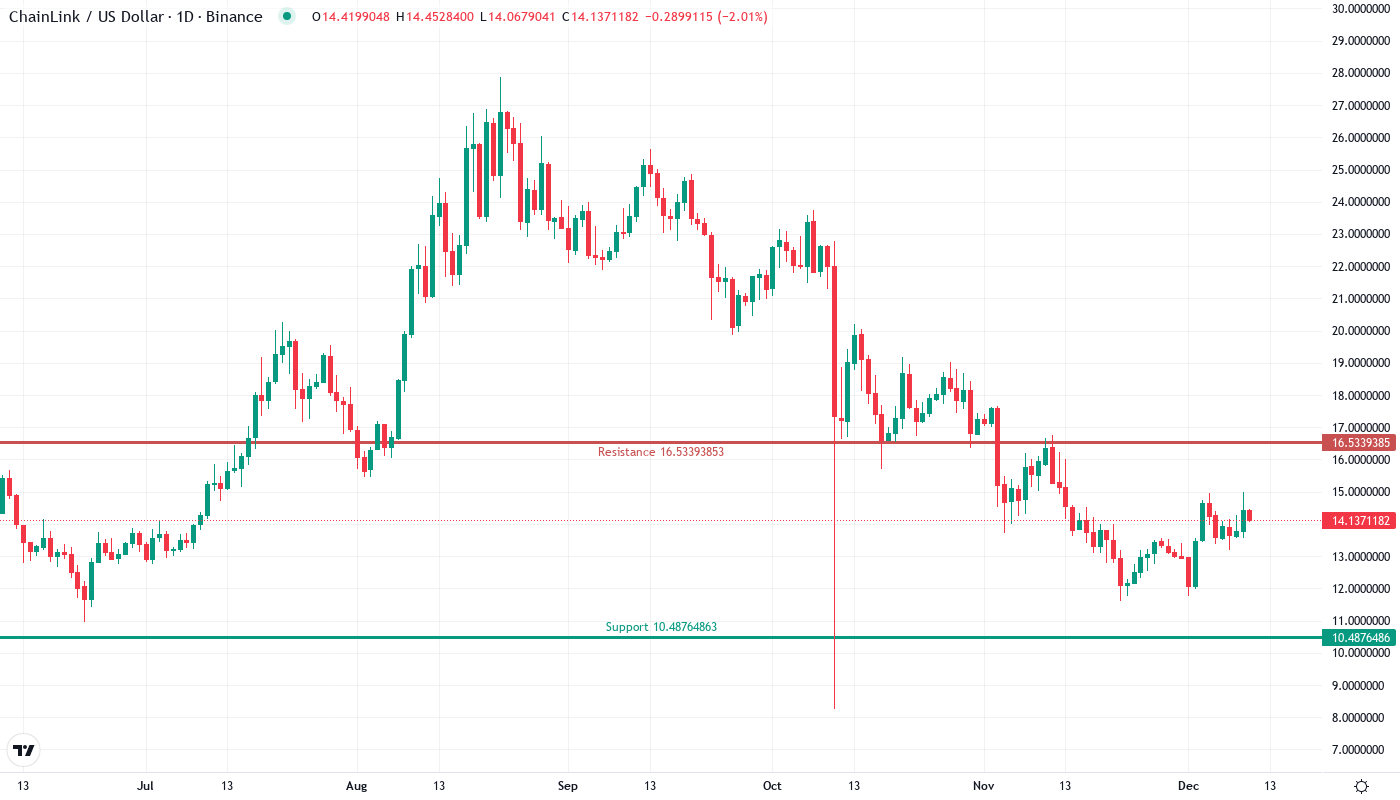
The price action has created a potential inverted head and shoulders or base setup that has been triggered with $1.60 upside follow-through. This pattern projects a theoretical measured move target of $16.50 that coincides with December’s swing high. The $15 to $16 resistance zone is ground zero for a plethora of trapped longs that will look to exit on rallies to breakeven if the token fails to stage a sustained rally above that range. If bulls overtake $16, the levels to watch are $17.25 and $18.25.
| Metric | Value |
|---|---|
| Asset | CHAINLINK (LINK) |
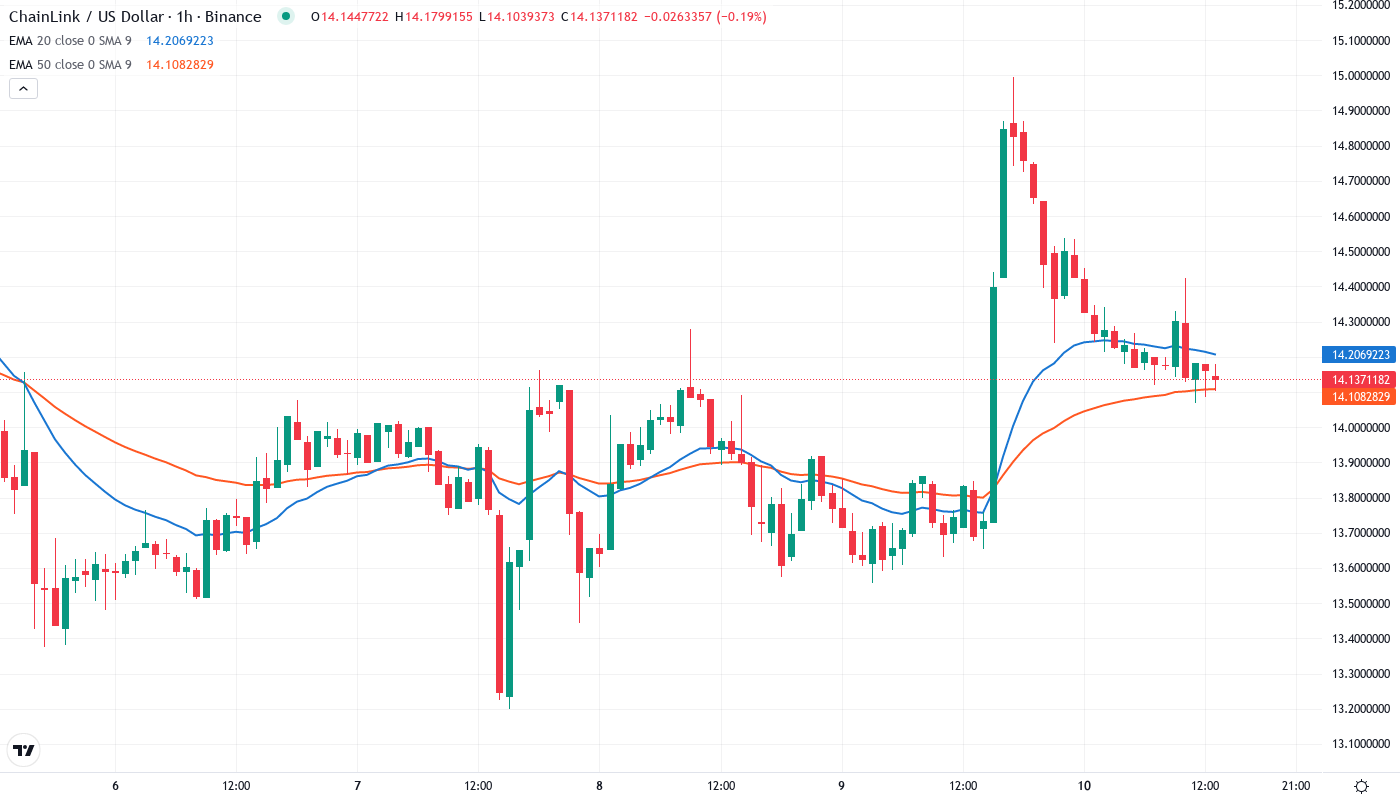
| Current Price | $14.11 |
| Weekly Performance | 4.62% |
| Monthly Performance | -11.09% |
| RSI (Relative Strength Index) | 51.0 |
| ADX (Average Directional Index) | 25.6 |
| MACD (MACD Level) | -0.16 |
| CCI (Commodity Channel Index, 20-period) | 101.03 |
RSI Climbs From Oversold Territory – First Recovery Signal Since December Crash
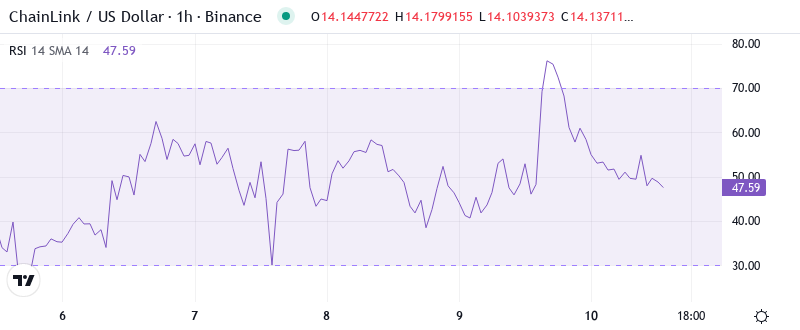
The oscillator reading is 44.12. It shows that momentum has at last stepped out of the sub-30 hell hole that embodied December’s give-up phase. What’s been interesting about RSI throughout this rally is that it moved from heavily oversold conditions around the 30s to more neutral levels, rather than overbought levels, indicating real buying rather than short-covering. A weekly RSI at 47.01 confirms this is not simply a lower-time frame swing.
Comparable RSI readings in November led to the rally up to $16.75, although that rally was starting from less oversold areas. For swing traders, this neutral RSI gives more room to run before hitting overbought resistance, but the pace of any rally could be slower as overhead supply from trapped longs is dealt with. It is obvious that the news from Mastercard changed sentiment right on a crucial technical support level that gave the bulls the impetus to defend.
ADX at 25.58 Signals Trend Awakening After December’s Directional Void
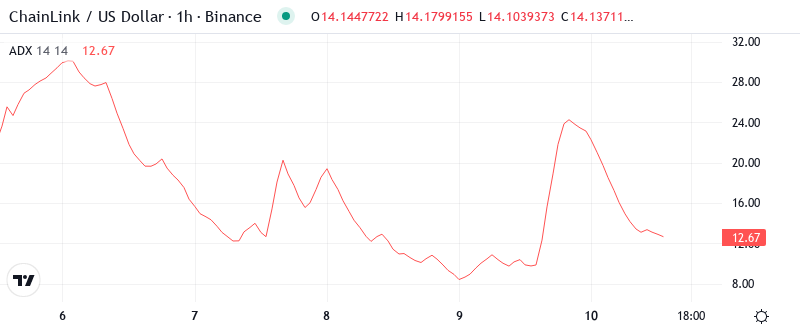
This ADX level of 25.58 and the bullish implications could explain why Chainlink has outperformed Bitcoin 8.52 percent to 7.81 percent today. The spread approaching 0.83 could be the sort of decisive upside that will help cement the positive breakout and bolster the LINK uptrend heading into February.
In other words, the ADX is suggesting that a move is afoot from a scenario wherein range trading was king to one in which trend followers reign. Hence, day traders need to adapt to this — stop trying to fade every move and start attempting to catch a ride on momentum in the direction of the break. There are 3.5 billion possible new users about to access Chainlink-powered DeFi directly through their Mastercard infrastructure, so the fundamental backdrop is for a sustained directional move rather than yet more chop.
20-Day EMA at $15.00 Becomes First Major Test for Recovery Rally
The market structure remains in clear technical freefall when looking at the daily LINK/USD chart. The consistent downtrend brought Chainlink back to price levels not seen since late June of this parabolic rally, with few wicks in between to establish any immediate demand areas. It is becoming increasingly likely to see another cascading down of price levels should the recent local bottom of $11.58 fail to hold. This would target the 30th-of-July low near $9.70 and logical support near the macro low of $7.18.
A closer look at the setup reveals that 50-day EMA at $15.75 appears as the most crucial level to beat for a potential recovery. The level thwarted recovery attempts thrice in December before the price crossed above it, reclaiming it now would indicate a substantial change in trend and not merely an oversold relief. The 200-day EMA is a long way up at $16.01, which further assured that the uptrend from the lows of August remained firmly intact despite a sharp correction in December. The bulls would need to capitalize on the Mastercard spending to pierce through this resistance.
Resistance Clusters Dense Between $15.75 and December’s $16.75 Peak
There are multiple resistance levels above the current price, which will make it difficult for the bulls to push the price higher, although there is a strong fundamental catalyst. The 50-day EMA level of $15.75 and the psychological level of $16 are the first hurdles. The 200-day EMA level of $16.01 is the most important resistance. A breakout and close above this level will signal the resumption of the uptrend. The bulls will then try to push the price to $16.75.
Buy your grammar books, Bears protected several support layers that were reinforced by the announcement of the agreement this week, and now the monthly low of $11.60 should be quoted after several tests. The 10-day EMA of $13.84 offers immediate dynamic support, with the psychological $14 level at which the price moves offering additional weight as the Mastercad announcement arrived exactly when the price tested the zone. Volume increased noticeably in the bounce of $11.60, indicating that institutional actors consider these levels valuable after the market expands.
The current configuration closely resembles a “textbook” accumulation pattern, with smart money taking advantage of the December washout to accumulate ahead of the impending Mastercard integration going live. The $11.60 – $15.75 range provides very clear parameters for traders (a 36% range) which offers numerous “scalping” opportunities as the larger trend sorts itself out. It should be noted that similar type of partnership announcements in LINK’s history led to multi-month rallies following the post-news volatility.
Bulls Require Decisive Close Above $15.75 to Confirm Mastercard-Driven Reversal
If the price is able to go back up and stay above the 50-day EMA which is currently located at $15.75, then the technical analysis will turn bullish and the price targets for such trend are $18–19. The Mastercard integration is the fundamental reason that could push the price up to those levels, as 3.5 billion cardholders will be granted a practically frictionless gateway to DeFi by leveraging Chainlink technology. The buying side must have high volume following any breakout of the price in order to avoid having a failed attempt.
If things turn bearish, it means that not even the partnership news was enough to keep the price above the $13.84 support level, which would show that the market is factoring in the risk of the project not getting the expected returns from the partnership or a general weakness in the cryptocurrency market. In this case, recent buyers are likely to be trapped, and the price will probably head to the next significant support at around $10.
Considering the technical setup and the potential upside catalysts in mind, a bullish posture makes sense, at least within a risk-defined context. If entering fresh LINK longs, a deeper-than-anticipated pullback risks just below the current C-wave low at $13.84. Position size accordingly, using the overhead resistance of the YTD VWAP at $15.75 or the recent bearish swing C-wave high breakout at $15.37 as a trailing stop to minimize adverse excursion.