Chainlink (LINK) Tests Critical $12.52 Support as Momentum Exhausts Near Multi-Month Lows
Market Structure Shifts Lower
- The current price of LINK is $12.52, which is a 28.2% decline from the multi-year high of $17.68 established in late December.
- Given this price action, panic selling seems to be in full effect.
- While the downside has been limited so far, the decentralized oracles token is poised for further losses.
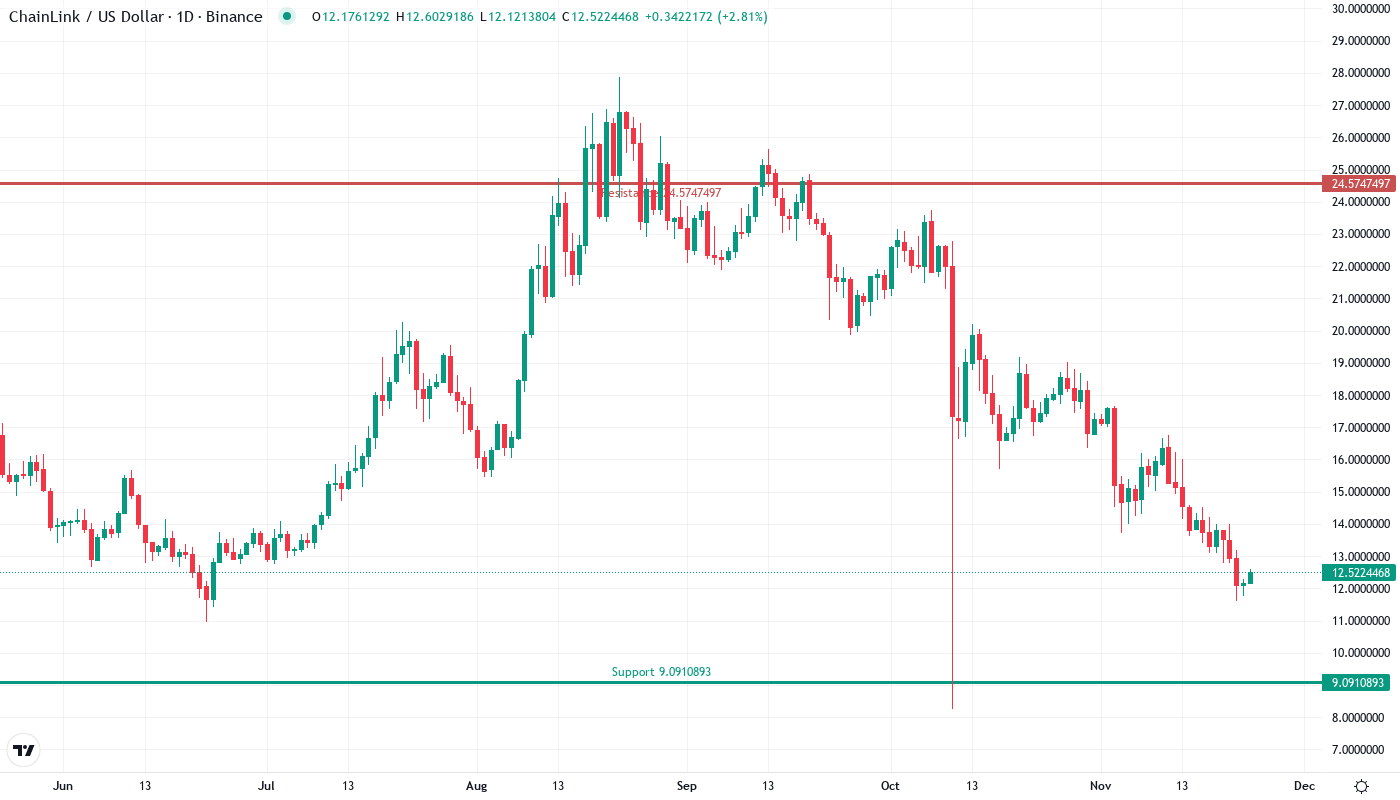
The price action has since morphed into a bearish descending triangle targeting a measured move around $6. A daily close under $11.60 will confirm the required three touches on the low indicative of downside exhaustion. Buyers must then step up if the LINK is to have any chance of forming a larger and more durable bottom. The ultimate backstop would need to hold even beyond the current waterfall low at $11.61.
| Metric | Value |
|---|---|
| Asset | CHAINLINK (LINK) |
| Current Price | $12.52 |
| Weekly Performance | -11.31% |
| Monthly Performance | -28.20% |
| RSI (Relative Strength Index) | 33.4 |
| ADX (Average Directional Index) | 47.5 |
| MACD (MACD Level) | -1.29 |
| CCI (Commodity Channel Index, 20-period) | -120.62 |
RSI Plunges to 33.40 – Matching August’s Capitulation Zone
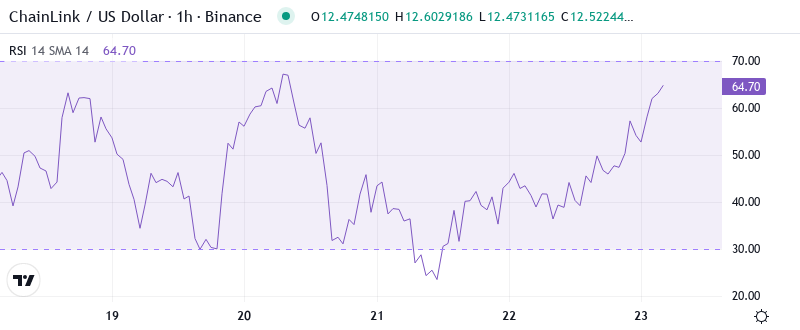
The Relative Strength Index shows a reading of 33.40 on the daily timeframe, the first oversold reading since August. While this brutal correction was followed by a 40% recovery rally, momentum collapsed as it did over the past two weeks, with the oscillator touching 65 during the December surge. The RSI readings in August and May were at levels that marked significant local bottoms, but both required several days of consolidation before a definitive reversal printed.
Now, for swing traders looking to play this potential oversold bounce, solutions do exist. Previous recovery attempts from sub-35 RSI readings were progressively confirmed through a price push back above 40 RSI. This cleared immediate short-term technical resistance, and a potential long entry presented itself upon this RSI turn. Post-entry, make sure the 15-min 8-EMA holds as short term support. From there on, the 15-min 31-EMA and 55-EMA serve as a progress update.
ADX at 47.49 Confirms Mature Downtrend Nearing Exhaustion
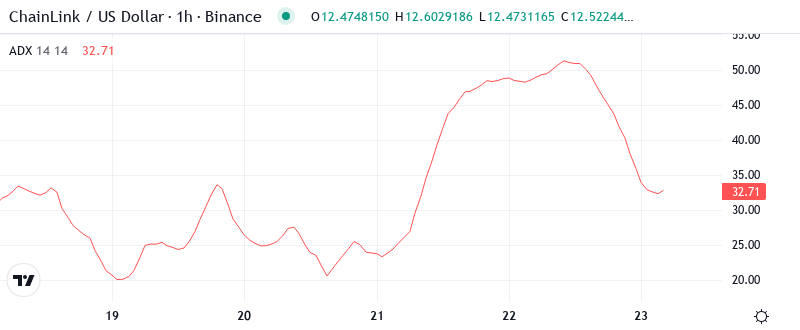
When considering the trend’s integrity, the 21-weekly moving average (WMA) presents a concerning view; only the second weekly close below the WMA since the rally began in March. The one other weekly close produced a bullish hammer candle, but bears have resumed control since. Buyers have thus far been unable to defend the WMA, indicating potential capitulation is necessary before any meaningful recovery.
Just to put things into perspective, anything above $43 screams extreme for most Chainlink holders anyway. So, unless you use a time machine to go back to the spring of 2019, chances are most of LINK above $43 is held by folks who are under water. Now Coin Metrics’ top holders data isn’t ideal, but it’s the best folks like us have. That means if LINK does enter a bear market, a lot of weak hands will be selling in volume.
20-Day EMA at $15.06 Caps Recovery Attempts After Support Flip
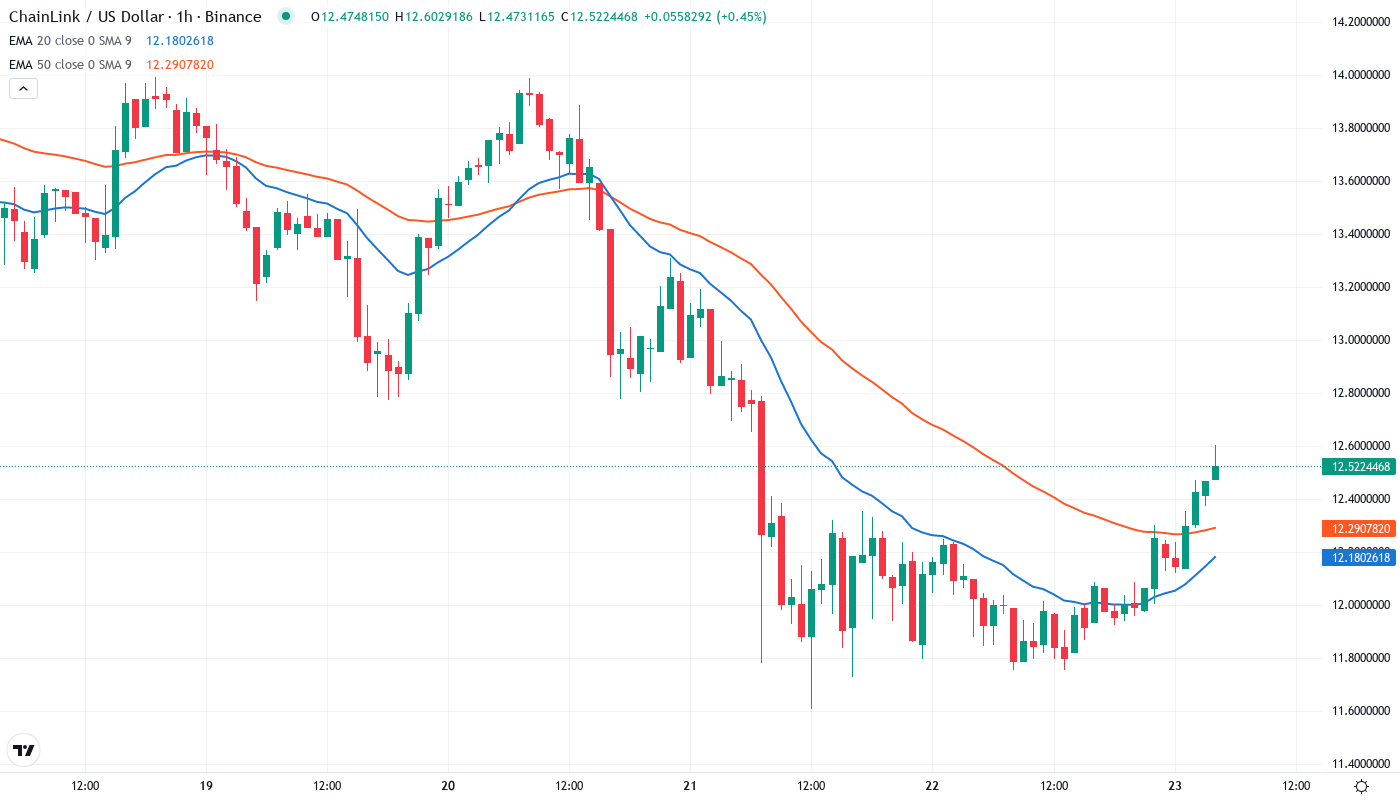
When combined with the performance of the 55-day EMA ($15.80), which is dying a death curl over the 200-day moving average ($16.11), this is a bearish medium-to-long term condition, given the last two before flipping bearish in early September have crested all of LINK’s prior macro bull runs from below.
The most important factor is the squeeze between the prevailing price ($12.52) and the 200-day EMA that is nestled below at $10.81. This long-term average has not been retested since the washout in October 2023, which is why it marks a vital inflection point for the macro trend. The previous resistance zone at $15.06 now turns a red line for the bears to protect – any daily close above it would indicate possible trend reversal, particularly given the institutional support from Grayscale.
Monthly Pivot at $11.61 Anchors Last Line of Defense
The closest support level is the monthly S1 pivot at $11.61. December’s low is right at this level. It is 7.5% less from the current quote. This level of price should be noted as it seems to attract the price – there have been three rebounds of this support over the past 6 months. Each time, the price increased by at least 15%. The next strong support zone will be the 200-day EMA and the $10 psychological level.
There is strong resistance in the $14.10 to $15.06 range, including the weekly pivot and 20-day exponential moving average (EMA). Additionally, the longer-term volume profile suggests that there is a high level of trapped long positions from December’s failed breakout, which will act as an additional resistance on any bounces. It is improbable that the stock will be able to break and hold above $15 without a significant news event or a more broad-based market rebound.
Very importantly, the market structure is forming a descending triangle with lower highs from the peak in December and multiple tests of the $11.61 base. Descending triangles are typically resolved to the downside with a measured move target in the vicinity of $9, or to the upside if price reclaims the upper trendline of the triangle around $15. The current overall Solana ecosystem strength and the Injective news would imply a much larger potential upside move if conditions improve.
Bears Target $9 Unless Bulls Reclaim $15.06 Decisively
For the short term, it is essential for the Chainlink bulls to push the price above the 20-day EMA at $15.06. If the price sustains above the 20-day EMA, the bulls will make one more attempt to push the price above the 50-day EMA at $16.38. If they succeed, it will suggest that the downtrend might be over.
The more pessimistic view comes with micro-cap stocks, of course, due to their extreme volatility. However, the exact opposite can also happen and a better-than-expected earning report could push the stock well above the resistance and towards the next ones.
Since it appears that whales have been accumulating over the past week and a half and are likely to defend the price from any significant losses, a relief rally towards $14 can be expected. These massive investors recently purchased 50 million LINK between $13.6 and $11.5, totalling $610 million. They are currently down by $35 million.