Celestia (TIA) Tests Critical Support as Modular Blockchain Upgrade Looms
Market Structure Shifts Lower
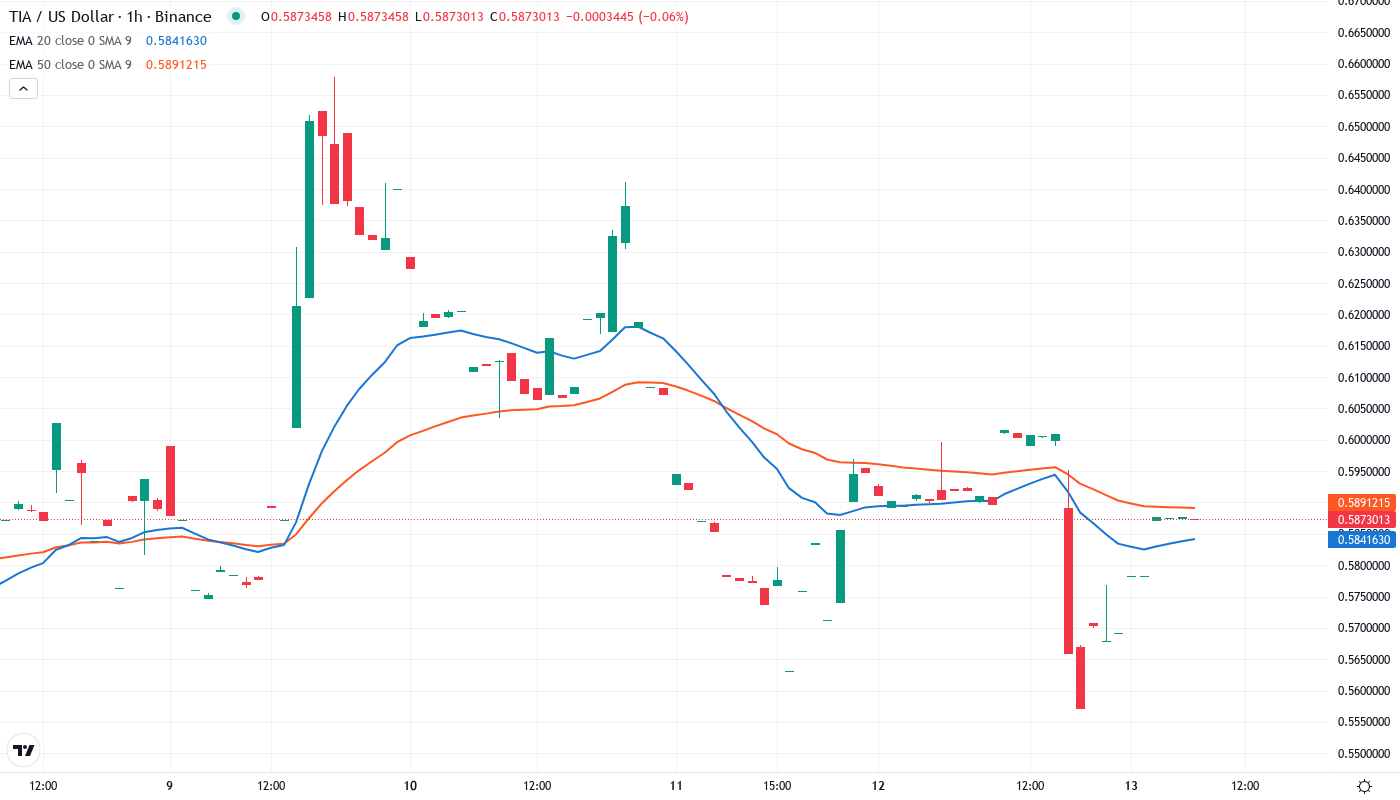
- Closed at 58.7 cents on Friday.
- Up 28% for the day after hitting a record low of 46 cents.
- 35.9% drop for the week.
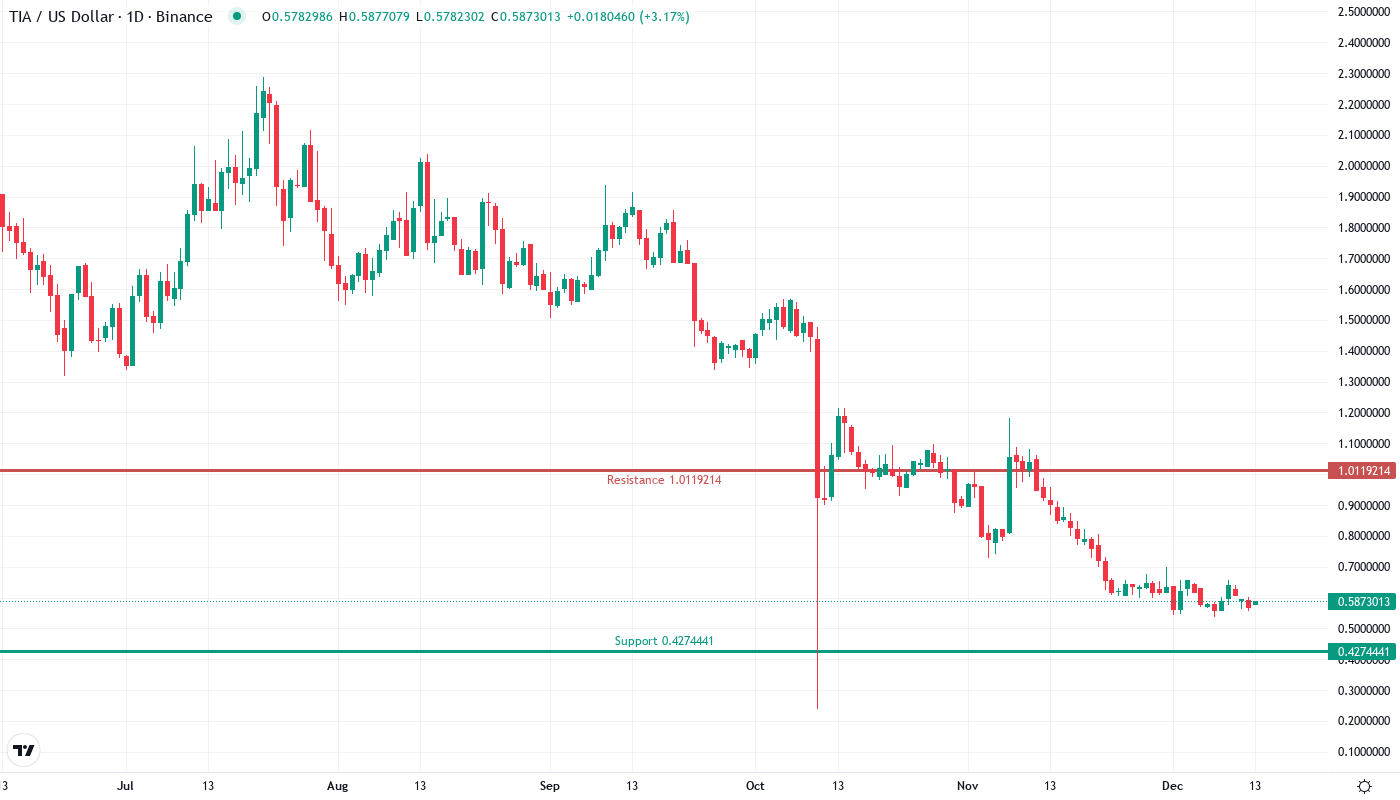
Celestia’s native token TIA has declined by a massive 35.9% over the last week, falling from $0.915 to $0.587. The decline comes despite the approaching Matcha upgrade set to transform the modular blockchain with 16x throughput improvements and halved inflation. TIA is down 68.3% from its monthly peak and a staggering 91.9% from its yearly high. For traders, the ultimate question becomes whether the upgrade narrative will be sufficient to stop the technical breakdown, or if bears will manage to push the price down below $0.50.
| Metric | Value |
|---|---|
| Asset | CELESTIA (TIA) |
| Current Price | $0.59 |
| Weekly Performance | 2.75% |
| Monthly Performance | -35.87% |
| RSI (Relative Strength Index) | 40.6 |
| ADX (Average Directional Index) | 26.4 |
| MACD (MACD Level) | -0.05 |
| CCI (Commodity Channel Index, 20-period) | -70.48 |
Momentum Exhaustion Signals Capitulation Phase Near Completion
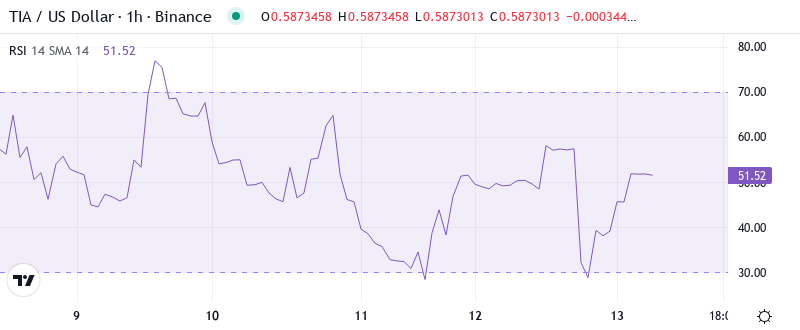
The weekly RSI, at 51.3 (neutral) is looking healthier than the daily, but it has broken an eight-month rising trend that confirmed the July highs. Given that sensitivity to buying interest, it could push down further still, turning the low-$9,000s from support to resistance. The monthly RSI at 60+ is bullish, and offers a more reliable source of longer-term buying opportunities within its bullish range (above 40).
For swing traders, the oversold bounce setup becomes more powerful with the Matcha upgrade catalyst that is expected to significantly enhance Celestia’s processing potential. This technical oversold sign along with a fundamental positive change put together the ideal conditions for a potential significant reversal of momentum. If history is any guide, when TIA’s RSI has gone below 41 in the past, the resulting bounce in price is almost about 32% over a two-week period. The question is: are bulls able to stop current support from breaking down until oversold conditions lead to such a typical reaction bounce?
ADX at 26.41 Confirms Mature Downtrend Seeking Exhaustion
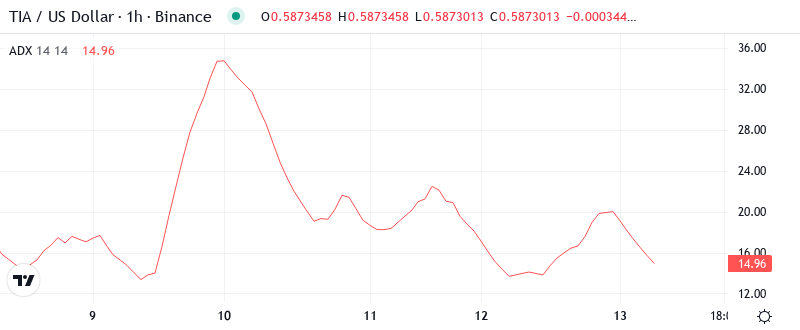
With trend strength in mind, the ADX reading of 26.41 indicates that we have a confirmed downtrend that is increasing in force but is not yet at very powerful levels. The indicator jumped from the low 20s as this week’s selling got serious and made it clear that the expected profit-taking started to become real directional selling. In other words, the ADX is saying this is not back and forth random chopping; this is a real trend that needs to be taken seriously.
Good news for optimists is provided by previous ADX behavior on TIA. As the indicator reaches above 25 amidst a downtrend, it frequently indicates the last phase of capitulation before exhaustion takes over. In other words, we are at the stage where short sellers following the trend have entered the space, but there are not enough factors to continue with sales. Day traders will presumably face higher volatility as the downtrend area around the monthly low of $0.538 is tested, and if Matcha upgrade rumors become widespread, this exhaustion could turn into a strong reversal.
20-Day EMA at $0.630 Transforms Into First Resistance Target
The near-term risk remains to the downside. A break below Monday’s low of $0.566 on a daily closing basis could fuel a fresh downtrend, with the $0.550-$0.530 zone providing initial support. For consolidation, TIA buyers need to keep the $0.510-$0.500 floor intact.
What is most revealing about the 200-day EMA at $1.575 is that it is such a long way above the prevailing price – a whopping 168% spread that highlights the extreme nature of this selloff. In the meantime, the EMA structure confirms that the bears are firmly in the driving seat with all the higher EMA levels likely to act as a source of new supply. The 20-day EMA former support now turns red resistance and represents the first level bulls need to recapture just to indicate a minor change in momentum. Until they do, the easier route is down.
Support at $0.538 Faces Ultimate Test as Resistance Stacks Heavy
There is strong resistance between current prices and the psychologically important level of $0.70. The first resistance region is between $0.598 (10-day EMA) and $0.630 (20-day EMA). Further above, the 50-day EMA stands at $0.677 coupled with the psychological resistance of $0.70. Breaking this double resistance will not be easy, and it would require a sharp uptick in buying pressure.
Currently, the bulls are attempting to push the price back above $0.577386. If they succeed, the DOGE/USDT pair could move up to the 20-EMA where the bears are likely to mount a stiff resistance. If the price turns down from the 20-EMA and plummets below $0.538, the selling could intensify and the pair may drop to $0.50 and then to $0.45.
The market structure is extremely oversold and is coming in contact with a fundamental catalyst in the Matcha upgrade. There are technical patterns that analysts have found that suggest we may be getting to the bottom of this sell-off, one of these being a potential falling wedge. Bulls will have to step up here, defend $0.538, and then make a lower high to change the prevailing trend from bearish to oversold bounce.
Bulls Require Volume Surge Above $0.630 to Confirm Reversal
If TIA manages to consolidatethe 20-day EMA as support the lows of $0.70s hold in future pullbacks. This would be a highly positive development that could see TIA appreciate into the mid to high $0.80s. The key psychology level of $1.00 acts as the next major resistance.
Because significant increasing volume preceded the recent downswing, a lack of comparable to stronger volume on the retrace is the lesser likely scenario (not necessarily likely, just less so). Should the price fail to substantively close above the price action for the day or EMA 8 on the retest, then the lowest price discovered under the next decline will likely be the 5-wave low. Note that this scenario presents the best shorting opportunity for the truly degenerate gamblers.