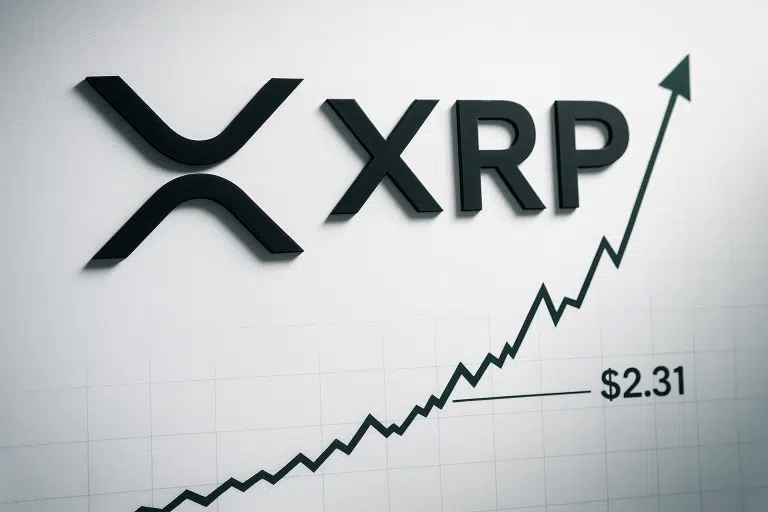
XRP ETF Approvals Spark Recovery as Price Climbs Above Critical $2.31 Support
XRP rebounds from December’s devastating 27% drop, reclaiming the crucial $2.31 level after SEC greenlights multiple ETF products. Bulls defend six-time tested support at $1.92 while targeting resistance cluster between $2.52-$2.58. Can this news-driven momentum sustain above $2.31, or will sellers emerge at December’s highs near $2.58?