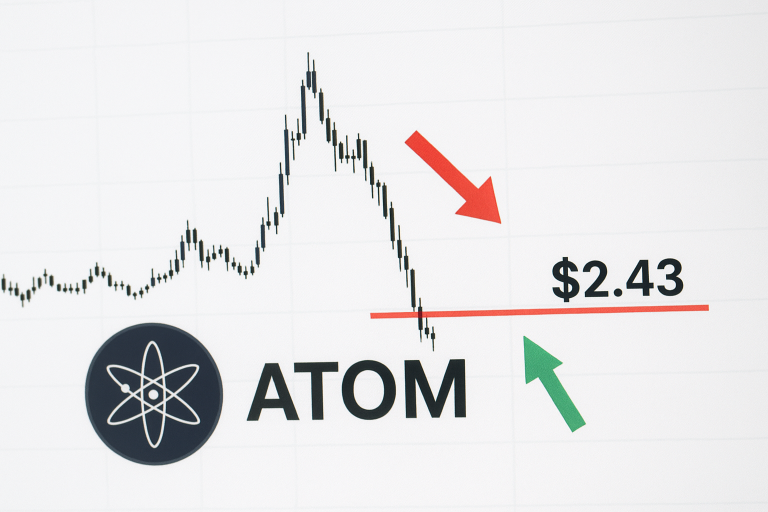
ATOM Tests Critical Support at $2.43 as Tokenomics Overhaul Sparks Debate
ATOM tests critical support at $2.43 as tokenomics overhaul sparks debate. Market structure shifts lower with the price down 17.6% over the past week. Price tests multi-year lows with RSI approaching oversold territory. Will proposed tokenomics changes provide a fundamental catalyst for recovery or will technical weakness persist?