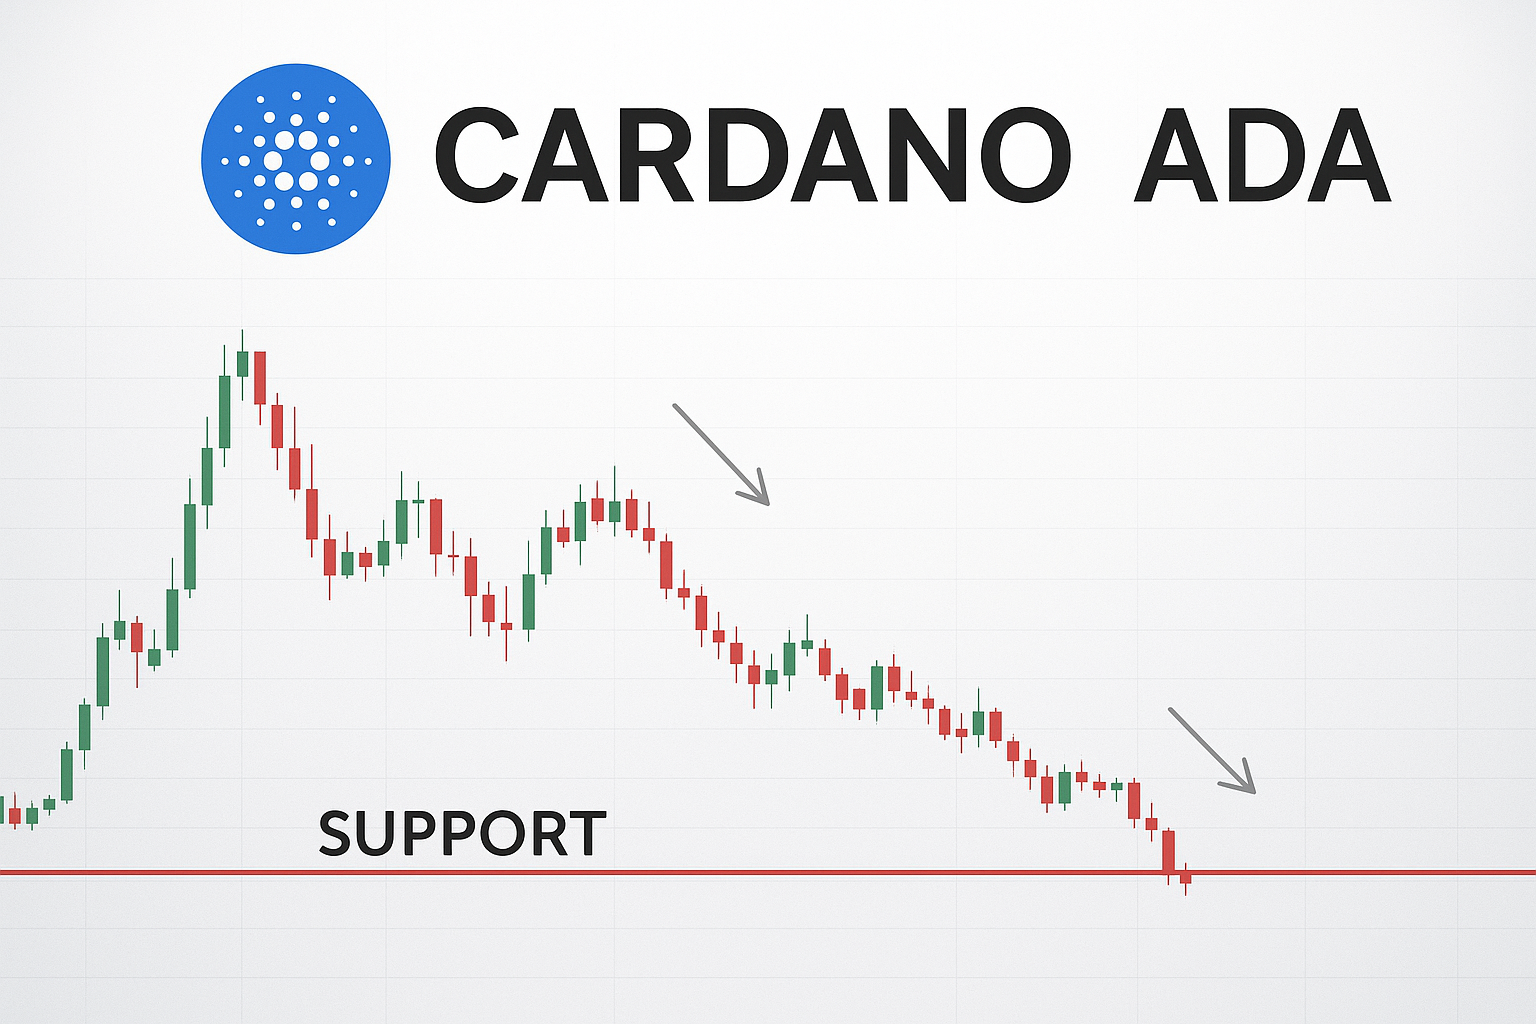
Cardano Tests Critical Support at $0.36 as DeFi Expansion Plans Meet Market Headwinds
Market Structure Shifts Lower
- ADA has dropped 18% so far this month to trade at $0.357.
- The losses more than erased the 17% gain notched in September as the market rallied in the wake of Bitcoin’s jump above $10,000.
- This was the first significant resistance it had breached since last year’s capitulation.
Traders must now look at the prospect of a 6th test of an important support region for ADA at $0.34.
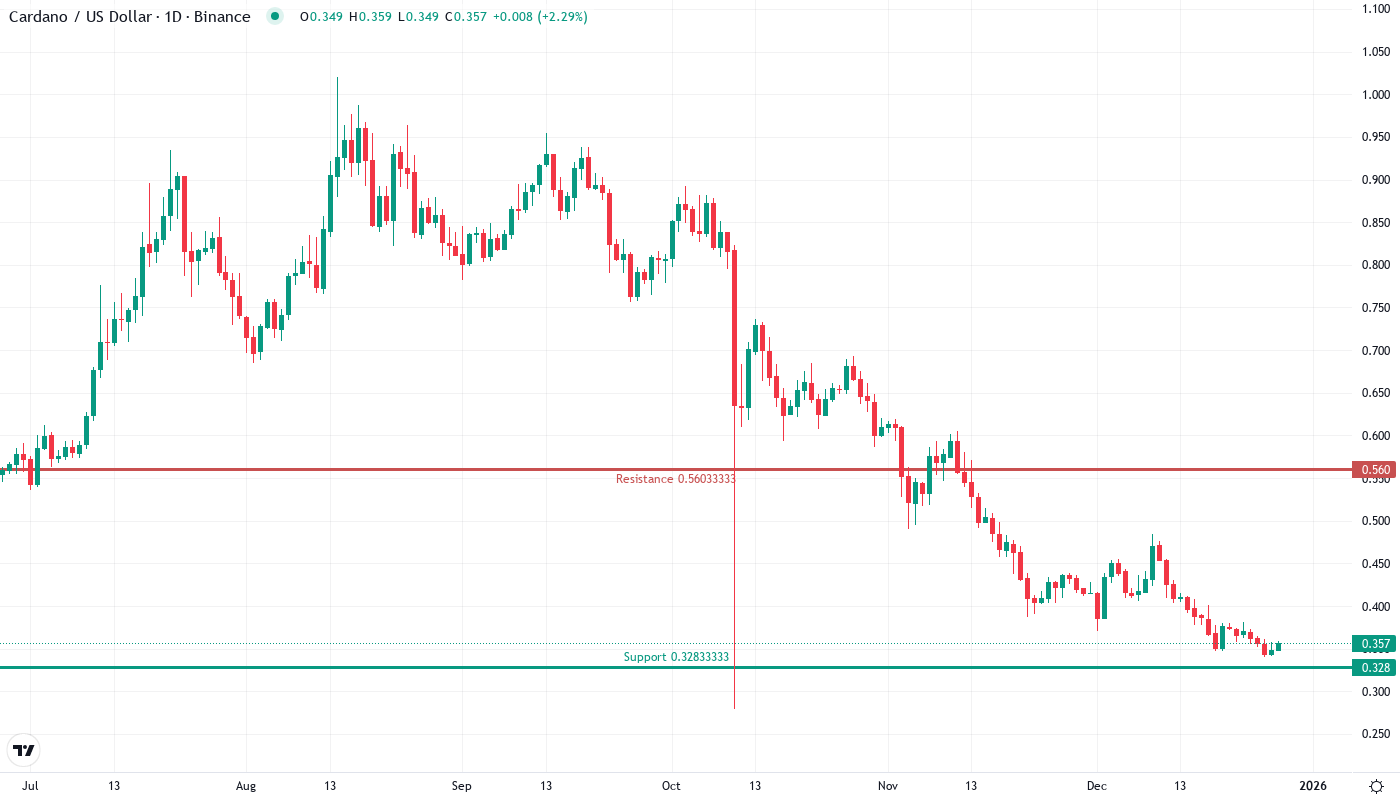
Cardano is at an important point as its price action undermines the multi-month minimum near $0.36. Over the past month, the cryptocurrency has lost 18.12% and is 54.41% from its quarterly peak, with sellers dominating the scene despite Charles Hoskinson’s DeFi expansionist plans linking ADA with the Bitcoin and XRP network. The main point of the traders is: does the $0.34 level of support that has been maintained six times since June resist the new attack or, for the seventh time, will this level eventually shatter the dam?
| Metric | Value |
|---|---|
| Asset | CARDANO (ADA) |
| Current Price | $0.36 |
| Weekly Performance | -5.05% |
| Monthly Performance | -18.12% |
| RSI (Relative Strength Index) | 38.1 |
| ADX (Average Directional Index) | 38.7 |
| MACD (MACD Level) | -0.03 |
| CCI (Commodity Channel Index, 20-period) | -78.28 |
RSI at 38.10 Signals Oversold Territory – But Not Capitulation Yet
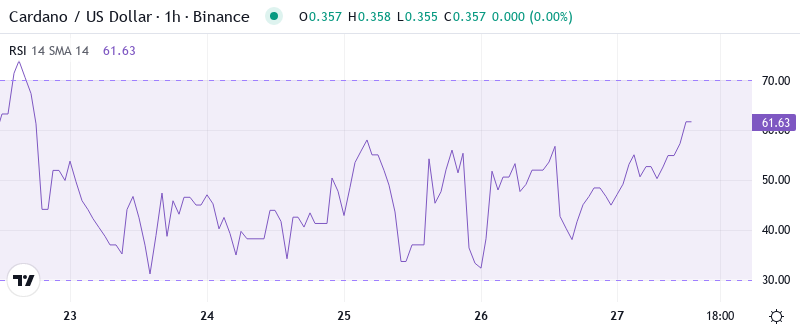
The oscillator reads 38.10 on the daily timeframe and shows on the verge of reaching oversold levels without getting to the extreme washout readings that tend to accompany major lows. A comparable RSI setting in September led to a 15% rally, but one that ran out of gas directly at the 50-day EMA. The weekly RSI reading is much more ominous at 31.63, indicating that the longer timeframe is nowhere near washed out.
This RSI setup isn’t ideal for swing traders as while ADA is oversold, it’s not at extreme levels where contrarian traders would look to step in and buy the discounted asset. News of ADA integrating with more decentralized finance (DeFi) applications and possibly fixing some of the bugs in Cardano’s smart contracts (using what’s left of the treasury?) should provide a positive fundamental catalyst for a relief rebound. But one may be limited due to the increasingly larger resistance clusters.
ADX at 38.70 Confirms Strong Bearish Trend Momentum
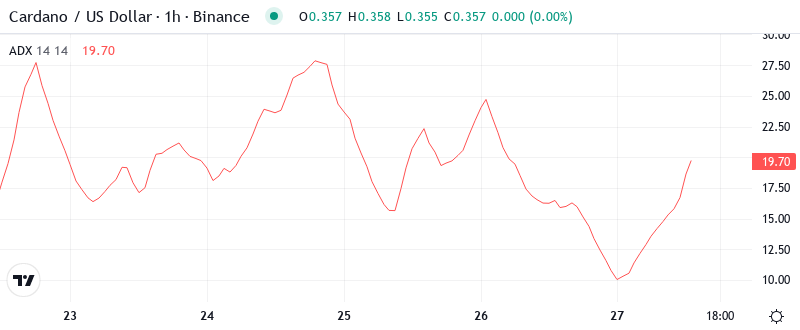
Readings above 25 confirm a solid trend is underway, and above 30, the trend has real strength. Between 40-45 is typical inflection-point territory, while over 50 a trend is deemed to be extremely strong. The last time ADX rose close to this level was during the chaotic bloodletting in August/September. That culminated in a trend peak near 72/73, and it’s fairly reasonable to assume buyers want to retain price above the 50-day EMA if that kind of damage is to be averted.
Hence, day traders need to implement trend-following tactics rather than contrarian techniques. For now, the January 24 gap between 2,968 and 2,981 marks highly visible resistance at 2,978. Adding to the importance of this level, the underside of this two-day gap also aligns perfectly with the S&P 500’s 2019 close.
20-Day EMA at $0.38 Caps Rally Attempts as Bears Control Structure
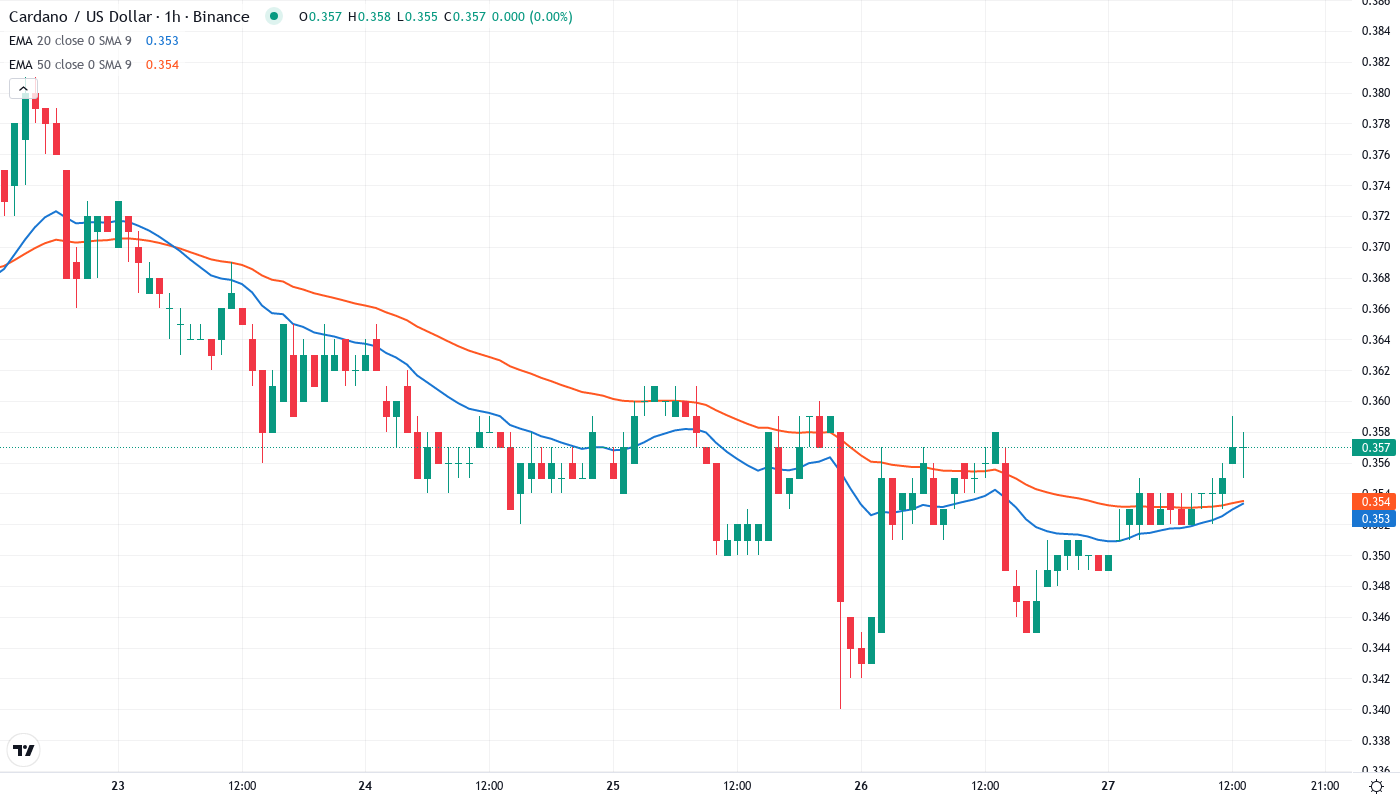
The RSI indicator is also a reliable predictor of momentum, and the loss of the 59-point (beige) level was a strong bear signal to sell, as it often acts as support in bull markets but transformed into impenetrable resistance in these conditions. Buyers must recover this position and then the 20-day EMA ($0.381) to stand a chance of re-trying last year’s all-time highs.
What is notably bearish is the squeeze between price and the 10-day EMA – a mere 1.6% separates them, so any relief rally gets washed out rather fast. On the macro, ADA remains ensnared within a descending channel, with the entire EMA stack hanging above, to function as dynamic resistance. Additionally, that previous support cluster around $0.38-0.40 now turns into a barrier that bulls need to pierce conclusively to indicate even a local trend shift.
Support at $0.34 Faces Seventh Test While Resistance Stacks to $0.48
Bulls are facing a very steep wall on the upside, with the 38.2% Fibonacci retracement level dropping down to a double match with the broken support at $0.365. Additionally, the 23.6% level lines up with prior July support at $0.391. Given this powerful confluence for bearish resistance, bulls likely need a news-driven event to reclaim this level.
Resistance is clustered $0.38–$0.48, as the 20-day and 50-day EMAs coalesce with horizontal resistance stemming from December’s breakdown. The monthly pivot point at $0.473 conflates with this just underneath the psychological $0.50 level. It’s worth noting that ADA is roughly 34% away from its 50-day EMA – something that is easier said than done with current momentum.
The market is characterized by a classic descending triangle pattern with lower highs registered since October and flat $0.34 support. Such patterns are believed to end up breaking in favor of the preceding tendency, and in this case, it is the bears. The decreasing range between $0.34 support and the descending resistance shows a possible breakout probably in the next 1-2 weeks.
Bears Target $0.28 If Support Breaks While Bulls Need $0.40+ Close
If the price does move above $0.48, XRP has plenty of overhead resistance and very little support below this level. This could lead to a sharp reversal back to the downside. For this reason, we do not expect ADA to move above $0.48 on this current rally. Most likely, we will see a good-sized pullback from $0.47 and try again later. In the worst case scenario, the coin will reverse back to a bearish trend.
If the $0.34 level holds, look for range-bound action between $0.34 and $0.39 to continue for the rest of the month. The longer the consolidation, the harder the subsequent breakout is likely to run. The daily RSI indictor is pointing onward toward the oversold threshold, suggesting weakness in coming days. ETC needs a fresh catalyst with follow-through volume to escape the $0.37-$0.39 range.
With a strong bearish ADX reading and a resistance-heavy structure above, a test of $0.34 support seems likely in the days ahead. The blockchain education initiative and DeFi roadmap will likely continue to offer strong fundamental support, but short-term technicals remain skewed to the downside, with the momentum indicating that sellers are firmly in control unless the price pushes above $0.40 and turns the 10-day HMA support.